13 Best Financial Analysis Software Tools For 2024
Financial professionals looking for the best financial analysis software in 2024?
Financial analysis is integral to any business, and having the right software can make all the difference. I’ve done testing and research to bring you a list of 13 of the best financial analytics tools available this year. From budgeting tools to forecasting models, these programs will help you get more out of your data and make better decisions for your business.
With these powerful tools, you can easily track performance metrics, analyze trends over time, create detailed reports with visuals and graphs, and even automate processes like budgeting or forecasting. You’ll be able to quickly identify areas where improvement is needed so that you can take action faster than ever before.
Check out our list now to find the perfect financial analysis software for your needs!
We’re reader-supported. We may earn an affiliate commission when you buy through links on our site.
My #1 Top Pick
Datarails
Best All-Around Financial Analysis Software
Special Offer: F9 Finance readers get 2 free seats added to their subscription
★★★★★
Datarails is a financial planning and analysis platform that automates financial reporting and planning while enabling finance teams to continue benefiting from Excel’s familiar spreadsheets and financial models.
What Is The Best Financial Analysis Software?
After testing the top products on the market in my own business and with my clients, here are my top picks for the best Financial Analysis tools this year:
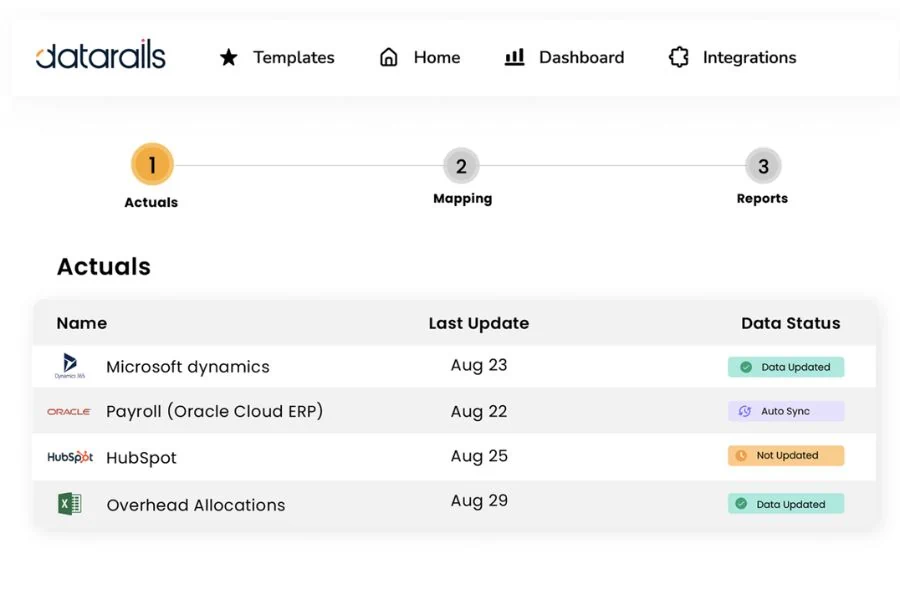
1) Datarails
Best All-Around Financial Analysis Software
Datarails is a financial planning and analysis platform that automates financial reporting and planning while enabling finance teams to continue benefiting from Excel’s familiar spreadsheets and financial models.
Automating these time-consuming manual processes paves the way for finance teams to spend more time analyzing financial data and less time gathering it. And it empowers them to answer essential strategic questions like what their organization can do to increase revenue and reduce expenses.
Key Features:
- Dynamic Financial Reports
- Data Upload & Automatic Consolidation
- Real-Time Financial Forecasting
- Smart Financial Analysis & Insights
- Integration with Third-Party Systems
What I Like:
Datarails is powerful, while also being flexible. I was impressed by how customizable it was while maintaining functionality, usually, that is a tradeoff. I also love how quickly users can get up to speed thanks to the Excel integration.
Pricing:
Datarails pricing is customized based on the unique “use-cases” and integration needs of your business. Click the button below to set up a free Consultation with the Datarails team. F9 Finance readers get 2 free seats with their subscription!
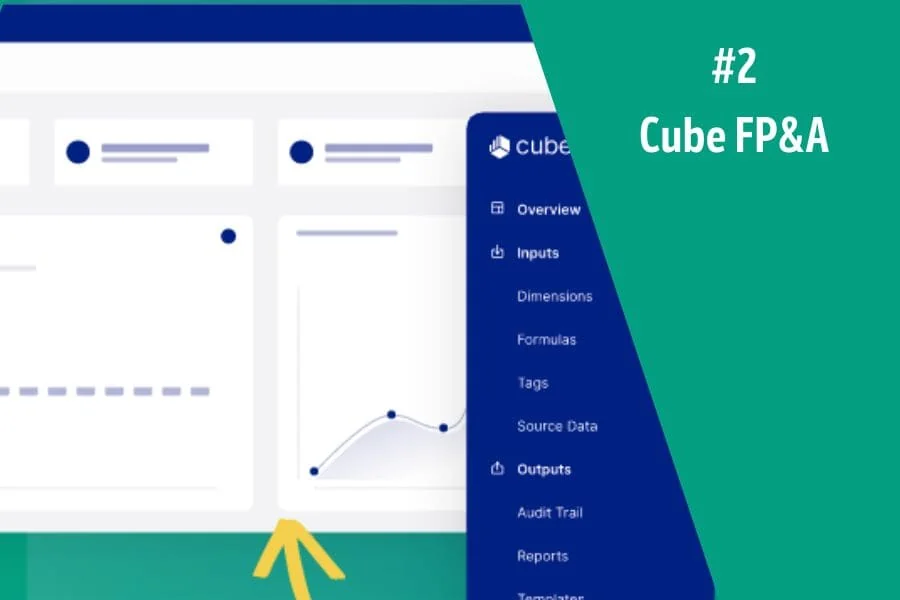
2) Cube
Best All Around FP&A Software
Cube promises to keep what you love about spreadsheets and automate what you don’t
Analyze instantly – Streamline manual data, reduce errors, and drill down so you can make smarter business decisions in a fraction of the time.
Plan confidently – Create accurate reports in seconds. Move faster with Cube—automate, actualize, and control with the click of a button.
Collaborate seamlessly – Cube lets you access data from the spreadsheet, making it easy for anyone to use and adopt. Get peace of mind with user controls and audit trails.
Key Features:
- Automated financial data consolidation
- Scenario analysis
- Customizable dashboards
- Centralized formulas and KPIs
- Integration with Microsoft Excel and Google Sheets
What I Like:
Cube is a sleek system and I was really impressed with the easy to build and easy to use dashboards
Pricing:
Three different plans with increasing levels of features ranging from $1,250/month to $3,750/month.
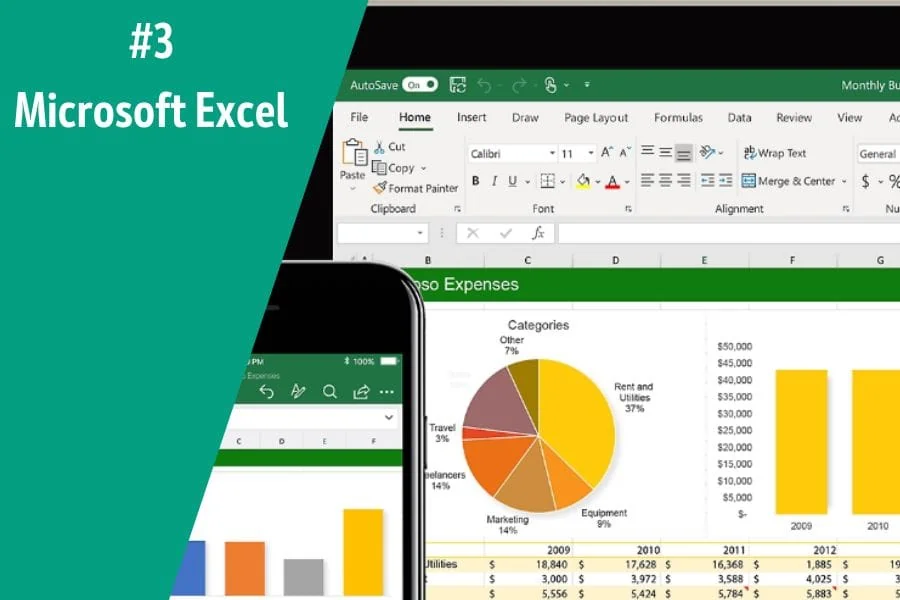
3) Microsoft Excel
Best For Price, Flexibility, And Ease Of Use
Microsoft Excel is the go-to financial analysis tool for Financial Analysts and Financial Modellers. It’s an incredibly powerful program that can be used to manage data, create models, and analyze financial performance.
Key Features:
- Formulas and functions
- Pivot tables and charts
- Data analysis and visualization tools
- Integration with third-party services
What I Like:
Everyone in Finance knows how to use Excel and while its not thought of in the same league as dedicated analysis software, it can do anything, anywhere, and at any time.
Pricing:
The Office 365 subscription includes Microsoft Excel, which starts at $6.00/month.
4) Causal
Build models effortlessly, connect them directly to your financial data, and share them with interactive dashboards and beautiful visuals.
Causal is an end-to-end Financial Modelling platform that helps you build, test, and deploy Financial Models quickly and reliably. With Causal’s easy-to-use interface, Financial Analysts can build models faster while maintaining accuracy.
Key Features:
- Model simulations & optimizations
- Powerful collaboration tools
- Data integration & visualization
- Model versioning & audit trails
Pricing:
Free plan for limited functionality, $250/month for small companies, and enterprise plans for larger organizations
5) Jirav
FP&A is faster and easier than ever before. Traditional FP&A solutions are too complex and expensive for today’s growth companies, while Excel is too fragile, frustrating, and cumbersome. Jirav simplifies FP&A and delivers the insights you need faster than any solution available.
Leave the pains of Excel behind with a purpose-built solution that shifts the complexity of FP&A from the user to the technology. Learn why Jirav sets the standard for “all-in-one” financial planning and analysis.
Key Features:
- Unified, Driver-Based, Financial Modeling Platform
- Customizable Financial Reports
- Advanced Business Analytics & Business Intelligence Dashboards
- Integration with Third-Party Systems like accounting software
Pricing:
Jirav has a range of plans, starting at $10,000 a year. This solution is targeted to growth companies, not so much small businesses.
6) Clockwork
Clockwork gives you real-time CFO-level insights on a company’s financial health to save you the pain of manually having to deal with finances and cash flow.
Your business’ finances and cash flow at a glance, automatically
Instant AI-powered projections and cash flow forecasts. High-level dashboard to see how your business is doing in real-time. Easy to understand and update graphs and charts.
Real-time weekly and monthly forecasts, up to 52 weeks out
Clockwork learns your business’s unique cash timing behavior allowing users to upload spreadsheets to forecast your cash flow with unmatched accuracy. Adjust your upcoming and overdue invoices and bills with a click to see the impact on your cash forecast. Will you need to cut costs? Get a loan? Investment? Instantly see your options and how they’ll impact cash flow.
Key Features:
- Accurate Financial Forecasting
- Data visualization tools
- Cash planning tool
- In-Depth Financial Insights
- Integrated Invoicing & Billing
Pricing:
$239/month for the Core plan and $639/month for the Pro plan
7) Budgyt
Budgyt is a dynamic FP&A platform that simplifies budgeting, forecasting, and reporting without sacrificing the granular details. Budgyt delivers user-friendly solutions for complex financial planning needs, making it easy for CFOs and finance teams to integrate financials, streamline processes, and manage multiple departments and users from a single source of truth.
With Budgyt, users can have the confidence to build and monitor budgets that accurately reflect their current financial performance. Financial professionals can take control of budgeting and forecasting processes with industry-leading features like automated financial data loading, integrated analytics, dynamic drill-downs, multi-department collaboration, custom forms & templates, and more.
Key Features:
- Multi-Department Collaboration
- Integrated Financial Analytics
- Data Automation & Consolidation
- Powerful Financial Modeling Tools
- Custom Reports & Templates
Pricing:
Budgyt starts at $499 per month for the “Easy Plan”, with larger plans costing up to $1399 per month.
Get Started With Budgyt:
8) Limelight
Limelight is a budgeting, forecasting, and reporting application allowing users to upload spreadsheets, identify real time variances, uncover growth opportunities, and optimize business performance.
Budget managers use Limelight to plan and forecast by designing and managing their own budget sheets with our user-friendly interface. They collaborate across departments in real-time, and create automated financial and comparative reports.
Executives & Management use Limelight to analyze trends in the business and identify growth opportunities and cost savings, monitor cash flow, and make informed decisions.
Key Features:
- Real-Time Financial Modeling
- Data Upload & Automation
- Dynamic Financial Insights & Reports
- Multi-Department Collaboration
- Custom Dashboards & Reports
Pricing:
Limelight pricing is customized based on the level of plan and the number of users for your organization.
9) NetSuite Reporting
NetSuite Reporting in Excel allows finance professionals to create and publish live management reports, forecasts, and financial statements in your tool of choice.
NetSuite’s Financial Reporting and Budgeting solutions provide a secure, cloud-based platform for creating, sharing, and analyzing financial information.
NetSuite helps organizations drive better decisions by providing key insights into their financial performance through a comprehensive suite of budgeting, forecasting, reporting, consolidations, compliance, and analytics tools.
Key Features:
- Work right in Excel
- Financial Reports & Statements
- Budgeting & Forecasting
- Consolidations & Financial Modeling
- Advanced Financial Analytics
Pricing:
NetSuite pricing is customized based on the level of plan and the number of users for your organization.
10) MODLR
Traditional financial and operational planning is too disconnected, overly complicated, and manual for growing businesses. For efficient and effective planning, you need an easy, powerful, and fast solution.
MODLR is business modeling and collaborative planning software that provides everything needed to enable a connected financial planning process. Financial planners can seamlessly build and share business models and scenario plans, and collaborate on budgeting and forecasting activities.
Key Features:
- Real-Time Financial Modeling
- Multi-Department Collaboration
- Advanced Financial Analytics
- Data Automation & Consolidation
- Custom Reports, Data Visualization Tools, & Dashboards
Pricing:
MODLR pricing is customized based on the level of plan and the number of users for your organization.
11) DriveTrain
Drivetrain is a next-generation financial planning, monitoring and decision-making platform. Our cross-departmental software helps teams build integrated plans, budgets and forecasts, track their progress against targets in real-time, and identify bottlenecks to growth.
Drivetrain consolidates data from over 200 business systems such as Salesforce, NetSuite, Quickbooks, Workday, and Looker to create a single source of truth and simplify business performance measurement.
Drivetrain powers several category leaders giving them a forward-looking view of their business and providing deeper insights to make faster, confident decisions.
Key Features:
- Financial Modeling & Forecasting
- Financial Reports & Statements
- Integration with accounting software
- Financial Automation & Consolidation
- Business Performance Measurement
- Financial Analytics & Strategic Insights
Pricing:
Drivetrain pricing is customized based on the level of plan and the number of users for your organization
12) Pigment
Pigment’s powerful modeling engine and intuitive user interface empower large organizations to plan faster and easily make financial data-driven decisions.
Pigment combines inputs from all your business apps (Netsuite, Workday, Bamboo HR, Greenhouse, Looker, Snowflake, and more) and lets you clean and enrich data in seconds.
With Pigment, run comprehensive financial scenarios in minutes, easily change assumptions and compare scenarios via beautiful tables and waterfall charts.
Financial and operational performance models can be viewed graphically or on interactive dashboards, allowing users to quickly review a company’s financial health and identify trends and problems.
Key Features:
- Financial Modeling & Forecasting
- Create Reports & Financial Statements
- Financial Automation & Consolidation
- Integration with accounting software
- Financial Analytics, Business Intelligence, & Strategic Insights
Pricing:
Pigment has three plans: Essentials, Professional, and Enterprise. You can contact Pigment directly for pricing sized to your organizations users.
13) Anaplan
Traditional planning, just like siloed systems and point solutions, is outpaced by change. Anaplan for Finance connects your people, data, and plans across your organization to empower the right decisions quickly.
Anaplan has the ability to connect operational planning with financial planning, enabling better decisions and more accurate forecasts.
Key Features:
- Centralized drivers and KPIs
- Highly customizable, doesn’t rely on IT support
- Role-based security for access control
- Integrate business planning with a company’s financial data
- Financial Modeling & Forecasting
- Financial Automation & Consolidation
Pricing:
Anaplan is highly customized, contact their sales team for pricing designed to meet your organization’s needs.
What Is Financial Analysis Software?
Financial analysis software allows users to quickly complete financial statement analysis and analyze different financial scenarios to make informed business decisions. Financial analysts, investors, and accountants use these tools to make predictions for the future of their business.
Financial analysis software uses historical financial data, internal metrics, benchmarking reports, market research, and more to help you understand where your business is now and to make informed decisions about where it’s going. Financial analytics software can also be used to create detailed reports with visuals that help you present data in a way that is easy for everyone to understand.
The features of financial analysis tools vary greatly depending on the provider, but most programs include budgeting tools, forecasting capabilities, and the ability to create financial dashboards. Financial analytics software can also be used for financial modeling and scenario testing. With these powerful tools, you can easily track performance metrics, analyze trends over time, and even automate processes like budgeting or forecasting.
Is Financial Analysis Software Worth It?
Financial analysis plenty of free options definitely worth it if you are looking to gain insight into your business. Financial analysis tools can help you make decisions that will improve the health and performance of your business, allowing you to optimize operations and maximize profits. Financial analytics software can also be used to make predictions about the future of your business, enabling you to plan for success. Financial analysis software can be used for everything from budgeting to forecasting, and the insights you gain can help you make smarter decisions that lead to long-term success.
How Can Financial Analysis Software Help You?
Financial analysis software can help you make better decisions that lead to success faster. Financial analysis tools provide insights into your business by allowing you to track performance metrics, analyze trends over time, and even automate processes like budgeting or forecasting. Financial analytics software also enables you to create detailed reports with visuals that make it easy for everyone to understand the data.
How Much Does Financial Analysis Software Cost?
The cost of financial analysis tools varies based on the provider and features. Many providers offer free options, while others are more expensive depending on the level of service you need. Financial analytics software can be a great investment if you have the budget – but plenty of free options provide basic functionality. Before deciding, it’s important to research the different options and find the right fit for your business.
Quick Recap
Financial analysis tools give business owners valuable insights and powerful tools to help them make informed decisions that lead to success. Financial analytics software allows users to quickly analyze financial statements and data points to identify trends and patterns, forecast future projections, and create detailed reports with visuals.
Financial analysis tools can be used for budgeting, forecasting, scenario testing, and more – giving business owners the insight they need to make smart decisions that lead to long-term success. Financial analysis software is worth it if you want to gain insights into your business, so research different providers and find the right fit for your needs.
Have any questions? Are there other topics you would like us to cover? Leave a comment below and let us know! Make sure to subscribe to our Newsletter to receive exclusive financial news right to your inbox. Thanks for reading and happy learning!