7 Steps To Build The Best Financial Dashboards
Are you looking for a way to better monitor your company’s finances? Financial dashboards are the perfect tool for tracking and managing financial data. They provide an easy-to-use interface that allows you to access all of your financial information in one place quickly. With these tools, you can easily create custom reports and charts that help you make informed decisions about how best to manage your money.
Read this blog post now to learn how to build the best financial dashboards!
Key Takeaways
A dashboard in finance is a visual representation of key financial metrics that provides insights into the performance of an organization. Finance dashboards typically include elements such as revenue, expenses, earnings, debt, cash flow, and other key performance indicators. These dashboards can be used to track the business’s financial health in real-time and make informed decisions that will help maximize profits and minimize losses.
The key to building an effective financial dashboard is gathering data from various sources, organizing it into meaningful visualizations, and monitoring KPIs in real-time. With the right tools and resources, finance teams can quickly create powerful financial dashboards to make better decisions and drive the success of their company.
What Is A Financial Dashboard?
The finance function of any business is responsible for managing the company’s financial resources. This includes tracking income and expenses, monitoring cash flow, analyzing financial trends, and making decisions about investments. A financial dashboard is an important tool that helps finance teams visualize and track key performance indicators (KPIs) related to their financial data. It helps you synthesize disparate financial information into one easy-to-use place.
A modern financial dashboard typically contains graphs, charts, tables, and other visualizations that provide an overview of the company’s financial health. It allows finance teams to quickly identify trends in their data and make informed decisions about allocating resources. By monitoring KPIs in real-time, finance teams can ensure they are making the most effective use of their budget and resources.
Creating a financial dashboard requires gathering data from various sources, such as accounting software, banking systems, and other internal databases. The data must then be organized into meaningful visualizations so that finance teams can easily interpret it. Once the dashboard is set up, it can be used to monitor the performance of products in real time and make adjustments as needed.
Financial dashboards are essential for financial professionals because they provide a comprehensive view of a company’s financial performance at any given time. They allow teams to identify potential problems before they become major issues and take corrective action quickly. Additionally, they help teams stay on top of their budgeting goals by providing insight into spending patterns over time.
Types Of Financial Dashboards

CFO Dashboard
The CFO dashboard overviews a company’s finances, including revenue growth, expenses, gross profit, net profit, and losses. It also includes KPIs related to cash flow, balance sheet analysis, and liquidity. The CFO dashboard allows finance teams to track key metrics at any given time and make decisions about investments based on their observations.
Budget Dashboard
The budget dashboard provides a detailed view of the company’s spending and revenue. It includes a breakdown of individual expenses, categorized by department, and an overview of total monthly expenses and income. This dashboard allows finance teams to quickly identify trends in their expenditures and make necessary adjustments to stay within budget.
Profit And Loss Dashboard
The Profit and Loss dashboard provides a detailed view of the company’s financial performance over time. It includes an overview of the company’s revenues, expenses, gross profit, net income, and KPIs related to each. This dashboard allows finance teams to easily identify potential problems in their spending patterns and make necessary adjustments accordingly.
Expense Detail Analysis Dashboard
The Expense Detail Analysis dashboard provides a detailed view of the company’s expenses. It includes an overview of each expense, categorized by department, and an overview of total monthly expenses. This dashboard allows finance teams to quickly monitor gross profit impacts and identify areas for cost savings and make necessary adjustments accordingly.
Cash Flow Dashboard
The Cash Flow dashboard provides a detailed view of a company’s cash flow. It includes an overview of the company’s total monthly income and expenses and a breakdown of individual payments and receipts. It usually includes a summary of cash inflows, cash outflows, and cash balance across different accounts. This dashboard lets finance teams quickly identify potential issues with a business’s cash flow and make necessary adjustments accordingly. Monitoring the cash conversion cycle is key for the Treasury and Finance teams.
Financial Reporting Dashboard
The Financial Reporting dashboard provides a detailed view of the company’s financial performance over time. It includes an overview of the company’s key financial statements, such as its income statement, balance sheet, and cash flow statement. This dashboard allows finance teams to analyze their performance and make necessary adjustments accordingly to improve profitability.
Balance Sheet Dashboard
The Balance Sheet dashboard provides a detailed view of the company’s total assets and liabilities. It includes an overview of each balance sheet item, categorized by asset or liability type, and a breakdown of total monthly activity. You can quickly answer questions like, “How much debt do we have.” This dashboard allows finance teams to identify potential risk areas and quickly make necessary adjustments. You can even track critical metrics like the Quick Ratio and the Debt Equity Ratio.
Financial Performance Dashboard
The Financial Performance dashboard provides a detailed view of the company’s business performance. It includes an overview of each key performance indicator, categorized by product or service, and a breakdown of total monthly activity. This dashboard lets finance teams quickly assess their overall finances and make necessary business decisions accordingly.
Executive Dashboard
The Executive Dashboard provides an overview of the company’s overall performance. It includes detailed information about current and past performance and projections for the future. This dashboard provides actionable insights and allows executives to review their company’s overall financial health quickly and make quick, informed business decisions.
How To Build The Best Financial Dashboard
The best financial dashboards are built with clear objectives and comprehensive yet easy-to-digest data. Here is a step-by-step approach to building a great dashboard, regardless of the type or audience:
Step 1: Set Objectives And Goals
Before building your dashboard, it’s important to determine the objectives and goals for the project. You need to answer the questions:
- Who will use this dashboard?
- What information should be included in the dashboard?
- How will the dashboard be used?
It is critical to talk to the target audience for the dashboard and understand their needs. The worst thing you can do is build a dashboard no one needs.
Step 2: Outline The Dashboard
Once you’ve identified the objectives and goals of the dashboard, it’s time to outline the structure. Start by breaking down the dashboard into sections, such as overviews, key financial KPIs, and comparisons. Determine which metrics need to be shown in each section and how they relate to one another.
Step 3: Gather Data And Other Inputs
Once you have an outline for the dashboard, it’s time to gather data and other inputs. This includes accounting data, financial statements, operational data, sales reports, and budget information. It is important to ensure that all of these data points are up-to-date and accurate to provide your users with an accurate financial picture. You can connect directly to an underlying finance analytics platform to build a live dashboard with real-time data. Building a dashboard without a strong, reliable data model is almost impossible.
Step 4: Build The Dashboard
Now that you have the necessary data and inputs, it is time to build the actual dashboard. Start by setting up the structure using dashboard software or creating your own visuals from scratch. Make sure to include all of the data points identified in the outline.
Step 5: Test And Adjust
Once the dashboard is built, it is important to test and adjust. Test the dashboard with a few users from your target audience and take their feedback into consideration when making adjustments. Make sure that all of the visuals are easy to understand and navigate.
Step 6: Change Management (Training)
Once the dashboard is complete, it’s important to ensure that all users in each business unit have adequate training. This includes going over the KPIs and how to interpret them. It also includes teaching users how to navigate the dashboard and use it as a tool to make decisions.
Step 7: Continuous Enhancement
No dashboard is ever truly complete. As new data points become available or trends change, it is important to tweak and update the dashboard continually. This can help ensure that users have access to the most relevant information at all times.
By following these seven steps, you can create a powerful and effective dashboard to help you make better decisions and improve your business outcomes.
Financial Dashboard Tools And Software
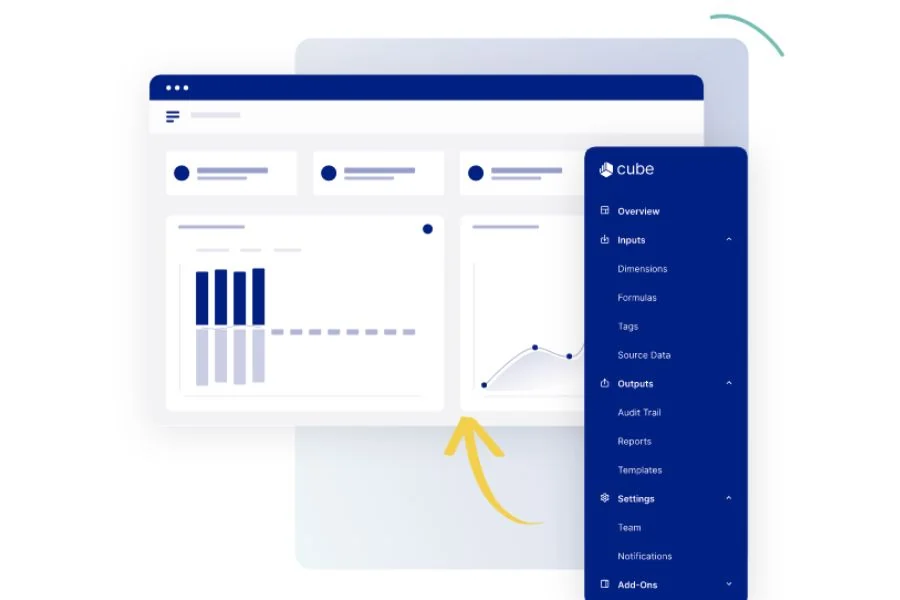
Financial dashboards can be built using various tools and software, including traditional spreadsheet applications such as Microsoft Excel, a business intelligence tool like Power BI, and specialized dashboard software. Popular solutions include Tableau, QlikView, and Power BI. Many financial software platforms like Cube FP&A also include financial dashboards as part of their core features.
Financial Dashboard Examples
Modern dashboards come in all shapes and sizes. Some of the most common types of finance dashboards are profit and loss statements, balance sheets, cash flows, budget trackers, and expense reports. Each type of dashboard focuses on a different aspect of business performance and provides detailed insights into different areas of your business.
A financial dashboard template is a great way to kick off your financial dashboard’s design process. Let’s take a look at some of the best financial dashboard examples on different visualization tools to help you get started.
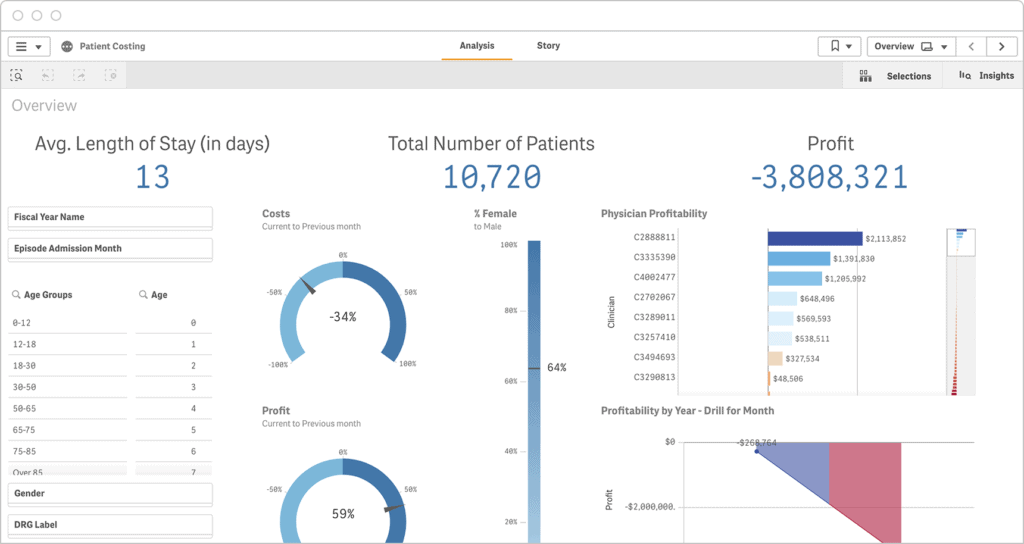
CFO Financial Dashboard Example Using Qlik
This financial dashboard example for a healthcare organization uses patient records, finance, and operational data to show the cost profiles of physicians. The system enables the CFO or their team to examine individual patient data and the resources utilized for their treatment.
Learn more about Qlik here:
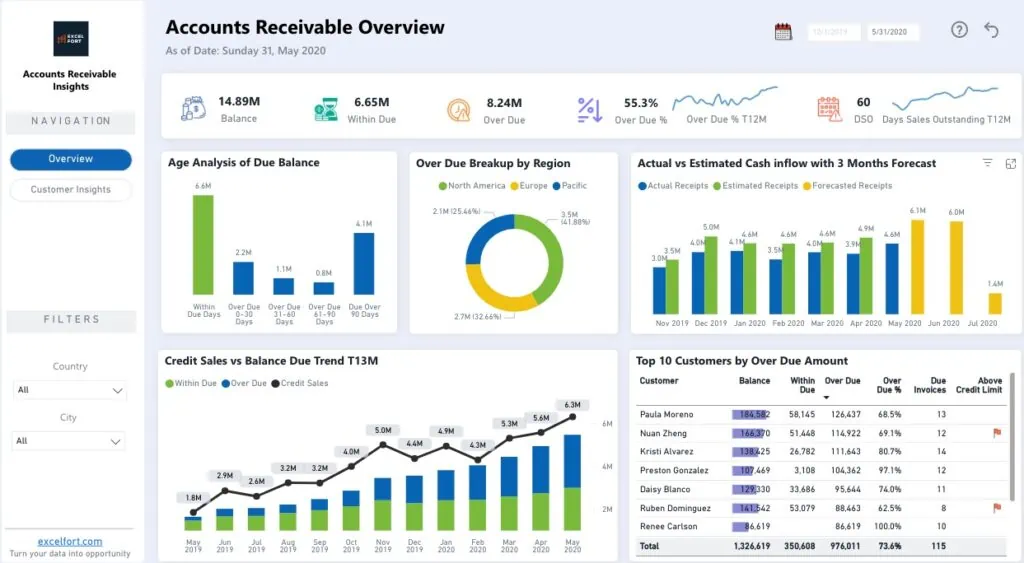
Accounts Receivable Financial Dashboard Example Using Microsoft Power BI
Managing Accounts Receivable (AR) is crucial for a company’s success, as it refers to the amount a customer owes for goods or services received and the process of converting this debt into cash. A graphical dashboard displaying receivables data can provide valuable insights into an organization’s receivables status and cash position. AR dashboards can even be set up to track metrics like the working capital ratio.
A highly interactive finance dashboard with drill-down capabilities for geography, period, customer, and invoice details can offer transparency.
Learn more about Power BI here:
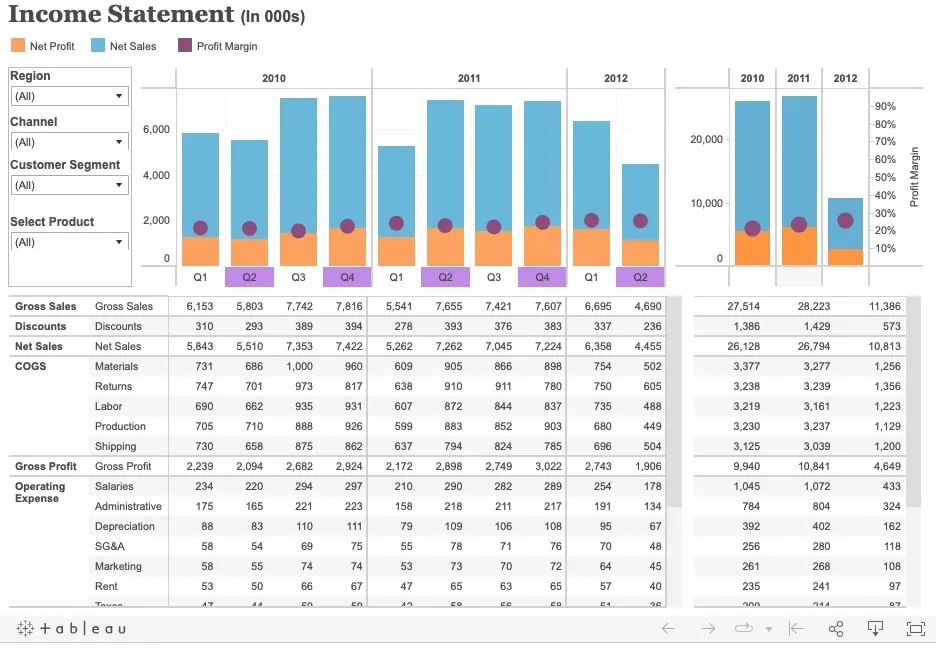
Financial Reporting Dashboard Example Using Tableau
Here is a financial dashboard example of a financial reporting dashboard. You can use the top two views to see an overview of your company’s performance for the past three years, including important financial measures like net sales, net profit, and net profit margin. The bottom section has cross-tabs that give a more detailed breakdown of your P&L statement, following the same quarterly and yearly format as the views above. You can use the filter panel in the top left corner to view your numbers based on different criteria like region, channel, customer segment, or product category.
Learn more about Tableau here:
Frequently Asked Questions
What Should Be On A Financial Dashboard?
A finance dashboard typically includes key metrics such as revenue, operating expenses, working capital, cash flow, and profitability. Including performance indicators like customer satisfaction and employee engagement is also beneficial. Other metrics that are useful for financial dashboards include gross profit margin, working capital ratio, inventory turnover ratio (ITR), and debt-to-equity ratio (D/E).
How Do I Create The Best Financial Dashboard?
A financial dashboard can be created using various software and tools such as Microsoft Power BI, Tableau, Qlik Sense, and more. You will need to select the data sources you want to include in your dashboard and then configure the visualization of the dashboard. Once everything is set up, you can explore the data and gain insights from your dashboard.
What Are The Benefits Of Having A Financial Dashboard?
A finance dashboard gives companies an easy-to-understand overview of their business performance. By having all the relevant metrics in one place, managers can identify potential problems quickly and develop strategies to improve key areas of their business. Additionally, finance dashboards can help companies improve their decision-making process by providing them with real-time data and insights into their business performance. They can even increase employee satisfaction due to the ease of use.
What Makes A Good Financial Dashboard?
A good financial analysis dashboard should be visually appealing, easy to understand and navigate, and include all of the relevant metrics in an organized way. The dashboard should also be customizable so users can filter and drill down into specific data points as needed. Additionally, it should provide the ability for users to access data from multiple sources and have the capability to analyze data over time.
Have any questions? Are there other topics you would like us to cover? Leave a comment below and let us know! Remember to subscribe to our Newsletter to receive exclusive financial news in your inbox.