
Sensitivity Analysis in Excel, Built So the Range Means Something

I remember when I first heard the term “sensitivity analysis”. It sounded like something out of a sci-fi movie, or perhaps a special technique used by psychologists. As someone who was just dipping their toes into the vast ocean of business finance, it felt daunting and overwhelming. I’ll admit, there were nights I lay awake, my mind buzzing with questions about this complex financial tool.
But let me tell you, dear reader, sensitivity analysis is not as scary as it sounds. In fact, it’s a bit like making your favorite dish. You know how you add a pinch of this, a dash of that, and then adjust the seasoning until it tastes just right? That’s sensitivity analysis in a nutshell. It’s all about understanding how different ‘ingredients’ (or variables) impact your ‘dish’ (or financial forecast).
Sensitivity analysis is what turns a forecast into a range. It helps us understand the potential impact of changes in input variables on our output or outcome. Think of it as a financial crystal ball, helping you peer into various possible futures based on different scenarios.
Now, if you’re feeling a little nervous, don’t worry! This guide is here to help. I promise, by the end of it, sensitivity analysis will be as easy as pie (and just as satisfying!). Here is how to build one, and how to read it once it is built.
Quick Overview
To perform a sensitivity analysis, you first identify the variables that might affect your outcome. Then, you adjust these variables within a set range and observe the resulting changes in your model’s output or decision criterion.
To calculate sensitivity analysis in Excel, you can use the Data Table, Scenario Manager, or Solver functions depending on the complexity of your model and the number of variables you wish to test.
To perform sensitivity analysis with a data table in Excel, you set up a table with different values for one or two input variables. Then, using the Data Table tool under the What-If Analysis options, you can see how these changes in variables affect your result.
Basics of Sensitivity Analysis
In its simplest form, sensitivity analysis is a way to predict the outcome of a decision if a situation changes. It’s like a “what if” game for your business finances, what if costs increase? What if sales decrease? What if my coffee machine breaks down and I can’t function without my morning caffeine fix? (Okay, maybe not that last one, but you get the idea!)
Imagine you’re planning a road trip. You’ve got your route mapped out, snacks packed, and your favorite playlist ready to go. But what if there’s a traffic jam on the highway, or what if your beloved ’90s boy band’s songs are not as sing-along-worthy as you thought? Sensitivity analysis is like having a backup plan for your trip. It helps you understand how these changes could affect your journey and allows you to plan accordingly.

Let’s bring it back to the business world. Suppose you own a boutique bakery. Your cupcakes are the talk of the town, and business is booming. But you’re worried about the fluctuating price of vanilla (a key ingredient in your secret recipe). A sensitivity analysis could help you understand how a change in the price of vanilla might impact your profits.
Or perhaps you’re considering expanding your business. Sensitivity analysis could help you predict how changes in market conditions, like a sudden cupcake craze or an unforeseen gluten-free movement, could affect your expansion plans.
Step-by-step Guide to Perform Sensitivity Analysis in Excel
Start with the one-variable version. It is not as daunting as it sounds. You and I are going to tackle this together, step by step. Just remember: every Excel wizard started with a single cell!
Make sure to download our free Excel template to follow along:
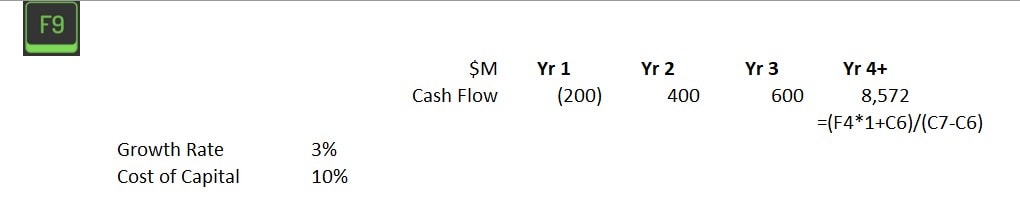
Step 1: Open Excel and Set Up Your Financial Models
Start by opening Excel, and take a deep breath. Trust me, Excel is more afraid of you than you are of it! Set up your data with the variables you want to test. This could be anything from the price of vanilla to the number of cupcakes you sell in a day.
For our example, we will test how the cost of capital (WACC) impacts free cash flows and the net present value of a project.
Step 2: Create a Variable Data Table
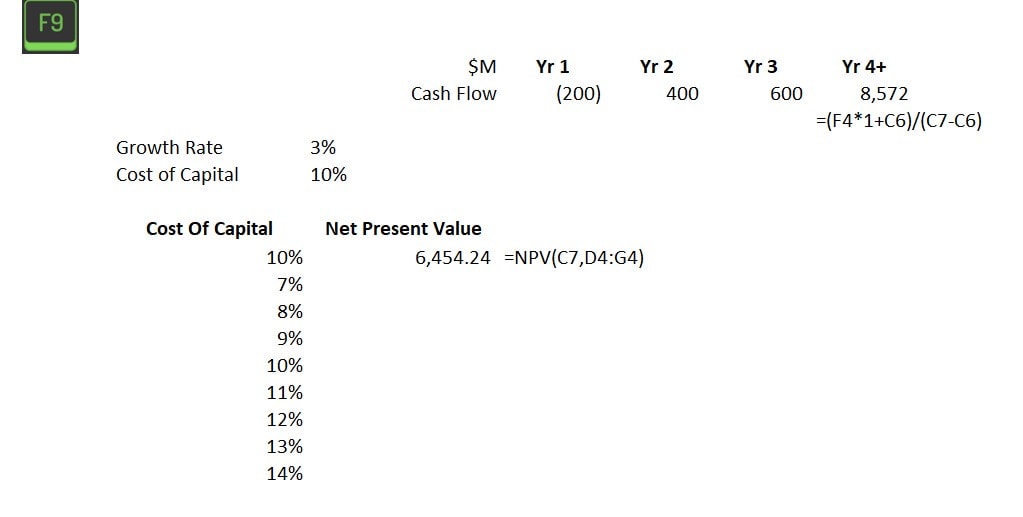
Next, we’re going to create a data table. This is where the magic happens. In one column, list the different scenarios for your input variable (for example, various prices of vanilla). In the corresponding row, link the desired output variable (such as profit).
For our example, the column inputs will be cost of capital and the corresponding Net Present Value.
Step 3: Insert the Data Table Function
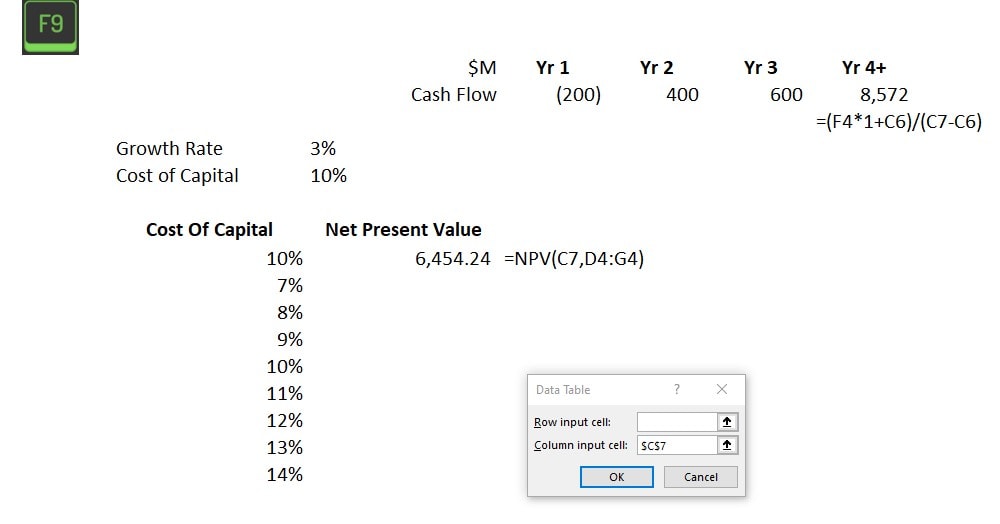
Now, go to the ‘Data’ tab, click on ‘What-If Analysis’, and select ‘Data Table’. A dialog box will pop up (don’t panic, it’s friendly!). In the row and column inputs cell, enter the reference to the original variable cell in the spreadsheet.
For our example, our data is in columns, so we will be using the column input cell. A row input cell is used if your data is set up horizontally. Link column input cells to cell C7, where we have the input variable: Cost of Capital.
The table, prebuilt
The AI library for finance teams
The one and two-variable sensitivity templates, plus the driver-finding prompts and the range sanity checklist. Free, and it lands in your inbox in about a minute.
Step 4: Watch Excel Do Its Thing
Once you hit OK, Excel will work its magic. It will fill up your data table with outcomes for each scenario. It’s like watching your favorite baking show, but instead of cupcakes, you’re getting delicious financial modeling!
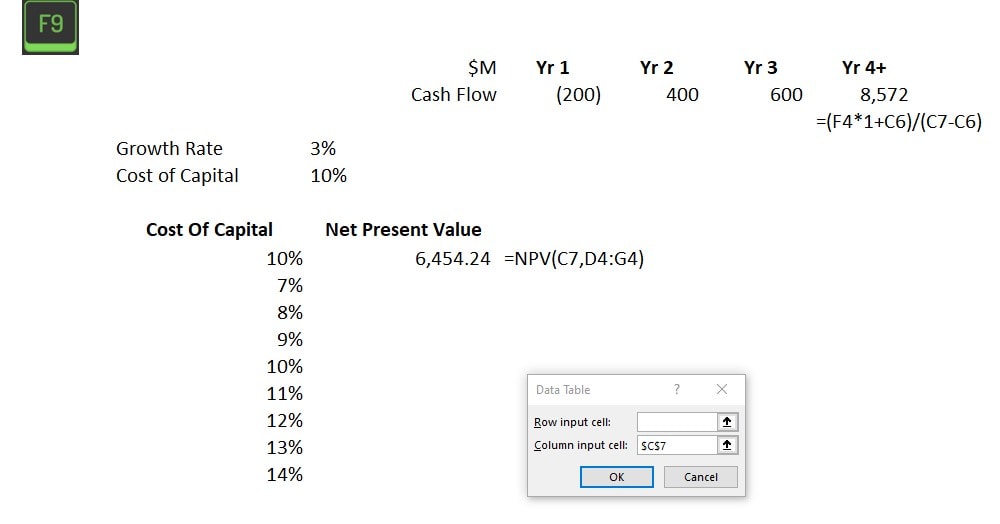
For our example, Excel populates the data table with our desired output and shows the net present value at each cost of capital holding all other variables constant. This provides valuable insights for management to consider when financing an investment.
Step 5: Analyze the Results
Lastly, pour yourself a cup of coffee, sit back, and analyze the sensitivity analysis results. Look for patterns, see which variables have the biggest impact, and use this information to make informed business decisions.
Remember, conducting sensitivity analysis in Excel is like baking. It might seem intimidating at first, but once you get the hang of it, it’s a piece of cake! And just like with baking, don’t be afraid to experiment and try different things. Who knows, you might end up creating the next big thing in financial forecasting… or at least, get a really good handle on your business finances!
Picking the inputs, which is the part AI is good for
The table is the easy half. The hard half is deciding which two inputs go on the axes, and getting that wrong produces a beautiful grid that tells you nothing.
Most sensitivity tables I see test the inputs that are easy to vary rather than the ones that move the answer. Price and volume, every time, because they are the obvious two. Meanwhile the thing that breaks the model is a collection assumption that never got flexed at all.
The prompt that finds the real drivers
Give a model your assumption list with the formulas that use them, and ask which three assumptions the output is most sensitive to and why. It reads the dependency chain faster than you will, and it catches the input that feeds four other inputs.
Then build the table on those. Not on the ones that were easy to reach.
- Ask what a skeptical reader would flex. This surfaces the assumption you have quietly treated as a fact.
- Ask for the breakeven value of each input, the point at which the decision flips. That single number is often more useful than the whole grid.
- Have it sanity-check your ranges. A range of plus or minus 2 percent on a volume assumption is not a sensitivity analysis, it is decoration.
- Do not let it produce the output values. Excel calculates the table. The model only picks what goes on the axes.
The failure mode to avoid is a model inventing a plausible range. Ranges come from history, from a contract, or from someone who owns the number, and a model has none of those.
For the forecast this sits on top of, financial modeling basics and regression forecasting are the two pages that feed it.
Common Errors and How to Avoid Them
We’ve all been there. You’re halfway through an Excel spreadsheet, and suddenly, everything goes haywire. The cells start spitting out numbers that look like they belong in a sci-fi novel, and you’re left wondering where you went wrong. Trust me, I’ve been there too. In fact, let’s take a trip down memory lane and revisit some of my own sensitivity analysis blunders.
Mistake 1: Ignoring Correlated Variables
Early in my career, I was analyzing the profitability of a coffee shop. I was so focused on the price of coffee beans that I completely ignored how it was tied to the price of milk. The result? A forecast that looked like I’d be sipping margaritas on a private island within a year. If only!
Takeaway: Always consider correlated variables. They’re like a package deal – you can’t have one without the other.
Mistake 2: Overcomplicating the Analysis
Once, in a fit of over-enthusiasm, I decided to include every possible variable in my analysis. The weather, the phases of the moon, the number of cats in the neighborhood, you name it, I included it. Needless to say, my analysis ended up as confusing as a maze.
Takeaway: Keep it simple. Focus on the key variables that have a significant impact on your outcome.
Mistake 3: Neglecting to Double-Check
This one still makes me cringe. I had painstakingly performed an entire sensitivity analysis, only to realize I had inputted the wrong initial data. It was like baking a cake with salt instead of sugar, not a tasty outcome!
Takeaway: Always double-check your inputs. An extra few minutes can save you a lot of headaches later on.
Advanced Tips for Sensitivity Analysis
Alright, my financial wizards in training, it’s time to level up! You’ve mastered the basics of conducting sensitivity analysis and are now ready to tackle some advanced techniques. But remember, with great power comes great responsibility. Don’t go all mad scientist on me!
Tip 1: Use Scenario Manager
Scenario Manager is like the Swiss army knife of Excel. It’s a tool that can create and save different groups of values or scenarios and switch between them easily. This can be super handy when you’re dealing with multiple variables and want to see how different combinations affect your outcome.
Tip 2, using Solver
Solver is another powerful tool in Excel that can optimize decision-making by adjusting your inputs to achieve a desired outcome. Want to maximize profit while keeping costs under control? Solver is your new best friend.
Tip 3: Monte Carlo Simulations
This method involves generating random inputs for your variables to simulate different outcomes. It’s like rolling dice, but instead of hoping for a six, you’re predicting future business performance. Just be careful not to get lost in the thrill of the gamble!
Now, let me tell you a tale of a time when I got a little too excited with these advanced techniques. I was analyzing a small lemonade stand (yes, you read that right). I had Solver running, scenarios multiplying like rabbits, and a Monte Carlo simulation that would make a Vegas casino jealous. I was lost in a sea of data, forgetting one crucial thing, the business was a simple lemonade stand! Let’s just say, it was an overkill.
So, remember this cautionary tale. While these advanced techniques can be incredibly useful, they are tools, not toys. Use them wisely, keep your analysis relevant to your business, and don’t forget to step back and look at the big picture.