
Easy Guide To Net Present Value (NPV) in Excel
Do you remember your first roller coaster ride? The thrill, the anticipation, and perhaps a pinch of fear? That’s exactly how I felt when I first bumped into Excel’s Net Present Value (NPV) function. It looked intimidating, almost like a roller coaster of numbers and symbols. But let me tell you a secret – just like that roller coaster ride, once you get the hang of it, NPV is more fun than fear.
So, what is this beast called Net Present Value? In the simplest terms, think of it as a time machine for your money. It allows you to see what your future cash flows would be worth in today’s terms. In other words, it helps you understand how much value your money can create over time, considering the fact that a dollar today is worth more than a dollar tomorrow due to inflation and investment opportunities.
But don’t worry, we’re in this together! By the end of this guide, you’ll not only understand NPV, but you’ll also be able to use the NPV function in Excel like a seasoned pro. So buckle up, and let’s dive into the world of NPV!
Key Takeaways
The function of NPV is to determine the present value of a series of future cash flows minus the initial investment. It’s a fundamental tool in finance for assessing the profitability of investments or projects.
To calculate NPV in Excel, you use the `NPV` function. The syntax is: `=NPV(rate, value1, [value2], …)`. ‘Rate’ is your discount rate, and ‘value1’, ‘value2’, etc., are your cash flows for different periods. Remember to include your initial investment as a negative number.
The Importance of Understanding NPV

Understanding NPV is like having a financial compass. It guides you through the stormy seas of investment decisions, helping you stay on course towards profitability. It helps you compare different investment opportunities, revealing which ones are likely to give you the most bang for your buck in the long run.
Excel will do the heavy lifting for you, so feel free to skip to the next section if formulas and calculations aren’t your cups of tea. First, however, here’s a quick overview for those curious about calculating net present value.
The NPV Formula is:
NPV = – I + ∑(CFt / (1 + r)^t )
Where:
I = Initial investment
CFt = Expected Cash Flows at time t
r = Discount Rate
t = Number of Periods.
So what are the benefits of using NPV? Net Present Value is an excellent tool for businesses and individuals to compare investments. It helps to make decisions based on the future value of cash versus its current value, considering potential inflation and other factors. Businesses can also use NPV to evaluate projects and calculate the return on investment (ROI).
There are unfortunately downsides as well. Since NPV relies on projections and assumptions, it is inherently more volatile than cash-based metrics. Also, the accuracy of NPV will depend on the quality and accuracy of your data. Therefore, the resulting analysis may be misleading if you make incorrect assumptions or input inaccurate numbers. Lastly, consider a significant investment or project with many factors. In that case, NPV can be complex and time-consuming to calculate.
Breaking Down the NPV Function in Excel
Now, let’s get up close and personal with the Excel npv function. In essence, the NPV function is a superhero tool that calculates the present value of a series of future cash flows. It’s like a financial crystal ball, helping you see how much your future money is worth today.
To calculate NPV in Excel, you’ll need three primary components: the discount rate, the number of periods, and cash flows.
Discount Rate
For companies, the discount rate will be the weighted average cost of capital as shown below. For individuals, inflation is a great benchmark. Therefore, we will use 3%, a standard placeholder for inflation.

Number of Periods
You must consider what periods (years, months, weeks, days) you want to evaluate. Fortunately, the flexible formula will automatically adjust to the number of periods entered. That said, discount rates are typically an annual amount. To adjust the formula for a shorter period, do the following:
-Annual: No change
-Quarterly: Discount Rate/4
-Monthly: Discount Rate/12
-Weekly: Discount Rate/52
-Daily: Discount Rate/365
Cash Flow
You will need a series of cash flows for the periods you want to evaluate. The cash flows can be linked directly to financial statements, or you can build a table to calculate the cash flows just for the formula. Remember that the initial cost needs to be a negative value
Step-by-step Guide to Using the NPV Function
Make sure to download our Free Net Present Value Excel Template to follow along:
Step 1: Select A Discount Rate
Before using the NPV function, you need to know your discount rate (the interest rate you could earn on the money elsewhere). To keep the example simple, we will use 3% which is a standard assumption for inflation.
Step 2: Create A Cash Flow Table
Create a cash flow table of the expected future cash flows for each period that you want to analyze. You will need to determine if the periods should be annual, or something else, and adjust appropriately.
Step 3: Input The Formula And Calculate Net Present Value
Here’s where the magic happens. Click on a blank cell where you want the NPV value to appear, then type “=NPV(” without the quotes.

Step 4: Analyze The Results
And voila! You’ve just calculated your first NPV using Excel. A positive net present value means the investment likely makes sense. If it is negative, you may want to reconsider the investment.
Now, here’s a piece of practical advice – always double-check your discount rate and cash flow values. A tiny mistake can lead to a big miscalculation. Remember, Excel is a tool, and like any tool, its effectiveness depends on how accurately you use it.
Bear in mind that Excel’s NPV function assumes that all cash flows happen at the end of the period. If that’s not the case for your scenario, you might have to adjust your inputs accordingly.
Real-life Examples of NPV Function Application
Now that we’ve cracked open the NPV function, let’s put it into real-life context. After all, what’s the point of learning a new skill if you can’t apply it to your everyday life, right?
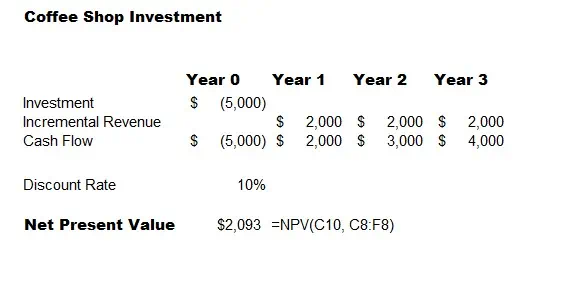
Example 1: The Coffee Shop Dilemma
Let’s say you’re the proud owner of a bustling coffee shop. You’ve got a loyal customer base, your baristas make a mean cappuccino, and business is good. But you have a hunch that investing in a new, high-tech espresso machine could boost your profits.
You know the machine is expensive, and it would take a few years to recover the cost. But would it be a wise investment in the long run? That’s where NPV comes to the rescue. By calculating the present value of future cash flows from the extra cups of espresso you’d sell, you can compare it with the cost of the machine today and make an informed decision.
Example 2: The Stock Market Roller Coaster
Imagine you’ve been eyeing a hot stock. It’s been on a roller coaster ride recently, but you believe in the company’s future prospects. Should you invest? Once again, NPV can help. By estimating future dividends and their present values, you can determine whether the stock is undervalued or overvalued at its current price.
Tips and Tricks for Mastering the NPV Function
Now that we’ve dipped our toes into the waters of NPV, it’s time to dive deeper. I’ve got a treasure chest filled with tips and tricks that I’ve gathered over the years – some through triumphs, some through trials, and some through those “oh, why did I do that?” moments.
So, buckle up and get ready for a fun ride!
Tip 1: Mind the Order
Excel is finicky about the order of cash flows. Remember, your first value should correspond to the first period, and so on. If you mix them up, Excel might just throw a tantrum (and by tantrum, I mean incorrect results).
Tip 2: Negative Numbers are Not Your Enemy
In the world of NPV, negative numbers aren’t bad news. They simply represent outflows of money, like an investment or expense. So, if you see a minus sign, don’t panic! It’s not a bug; it’s a feature.
Tip 3: The Discount Rate is Not a Discount Coupon
The discount rate is not a magical coupon that gives you a 20% off on your next shopping spree. It’s a percentage that represents the alternative return you could earn elsewhere. So, choose wisely, my friends!
Tip 4: The Crystal Ball Isn’t Always Clear
NPV is a fantastic tool, but remember, it’s not a fortune teller. It’s only as accurate as the estimates you feed it. So, don’t bet your house on it. Unless, of course, you have a crystal ball that actually works, in which case, please share your secret!
Quick Recap
Understanding and using the NPV function is like acquiring a superpower – it’s a game-changer that can help you make informed financial decisions. Whether you’re contemplating investing in new equipment, launching a product, or navigating the roller coaster world of stocks, NPV is your steadfast compass guiding you through the fog of uncertainty.
I know, diving into the world of finance can sometimes feel like learning a new language. It can be intimidating, even overwhelming. But trust me, once you’ve taken the plunge, you’ll discover it’s not as scary as it seems. In fact, it’s quite empowering. And I believe in you. You’ve got this!
Frequently Asked Questions
How does Xnpv formula work in Excel?
The `XNPV` function in Excel calculates the net present value for a schedule of cash flows that are not necessarily periodic. The syntax is: `=XNPV(rate, values, dates)`. ‘Rate’ is your discount rate, ‘values’ are the cash flows and ‘dates’ are the corresponding dates.
What is the formula for the discount rate in Excel?
The discount rate isn’t calculated by a specific formula in Excel, but you can calculate it using several methods, such as the Capital Asset Pricing Model (CAPM) or the Weighted Average Cost of Capital (WACC). It’s also often provided as a given in financial problems.
Why is Excel NPV different?
Excel’s NPV can be different because it assumes that the first cash flow occurs at the end of the first period, not at the start. This can cause discrepancies when the initial cost is immediate. To correct this, you can manually subtract the initial investment from the result of the `NPV` function.
Is Excel NPV accurate?
Excel’s NPV is accurate as long as the inputs (cash flows, discount rate) are accurate and the cash flows are periodic. For non-periodic cash flows, you should use the `XNPV` function.
Have any questions Are there other topics you would like us to cover? Leave a comment below and let us know! And subscribe to our Newsletter to receive exclusive financial news in your inbox.