
Variance Analysis Using Rate and Volume
If you’re like me when I was first starting out, you probably heard these terms thrown around in financial meetings and wondered, “What on earth are they talking about?”
Well, I’m here to demystify these concepts for you. You see, rate volume analysis is a handy tool that helps us understand why our actual results differ from what we budgeted or forecasted. It’s a bit like playing detective but with numbers! And when it comes to variance analysis—well, that’s the process of investigating these differences.
Key Takeaways
Think of it as your financial health check-up. Just as a doctor would diagnose and treat any health issues, variance analysis helps identify and address any financial anomalies. By pinpointing where your actual results deviate from your budget, you can take corrective action, whether that means adjusting your budget or changing your business strategies.
Think of rate volume analysis as a super sleuth tool that helps us break down our variances into two main parts: rate variance and volume variance. Rate variance is the difference caused by the actual rate or price you paid compared to what you budgeted. On the other hand, volume variance refers to the difference caused by the actual quantity used or sold compared to what you budgeted.
What Is Variance Analysis Using Rate And Volume?
What Is Variance Analysis?
The goal of variance analysis is to provide insight into actual performance versus a comparable. The comparable can be the prior year, prior month, or a budget/forecast. It’s used to identify and assess reasons for variances in goals or expectations.
What Are Rate And Volume?
In variance analysis, rate and volume are two ways of measuring performance. Rate is the ratio between two data points—for example, sales divided by customers or expenses divided by revenue. Volume refers to the number of times something occurs—like customer purchases or shipping costs.
Benefits Of Using Rate And Volume For Variance Analysis
It goes a step further than the nominal change! You can evaluate the impact of different business drivers and break them out into component parts to ensure you are focusing on the correct business decisions. You can also dig deeper into business variances and provide a more compelling story.
This type of variance analysis goes hand in hand with driver-based forecasting as the inputs to the forecast are the outputs from the variance analysis.
Rate And Volume Drivers
Here are some examples of common rate and volume drivers you will come across:
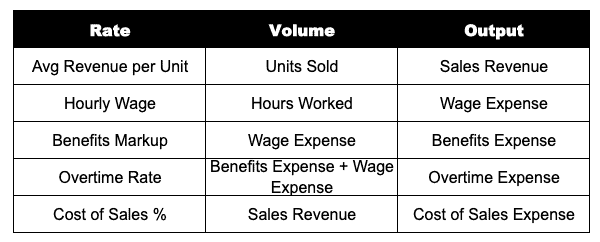
Rate and Volume Formulas
Rate Formula
(Actual Rate – Base Rate) x Actual Volume = Rate Variance
In the formula, “base” is the comparable, whether that be prior year, prior month, or a budget/forecast.
Volume Formula
(Actual Volume – Base Volume) x Base Rate = Volume Variance
Similar to the rate formula, “base” is the comparable, whether that be prior year, prior month, or a budget/forecast.
Mix Formula
Mix Variance = (Actual Rate – Budgeted Rate) * (Actual Avg Bal – Budgeted Avg Bal) * Basis
Real-World Example
Example: Analyzing Budget Versus Actuals
In this example, we will look at a simplified Profit and Loss statement (P&L) for a single month. We will have actual results as well as the budget for the month and the prior-year period. To perform rate and volume analysis, you will want to have a separate section on the P&L for financials and KPIs.
In this example, I have provided the KPIs driving both sales revenue and wage expense as shown in the table above. In addition, I noted the rate drivers and volume drivers for your reference.
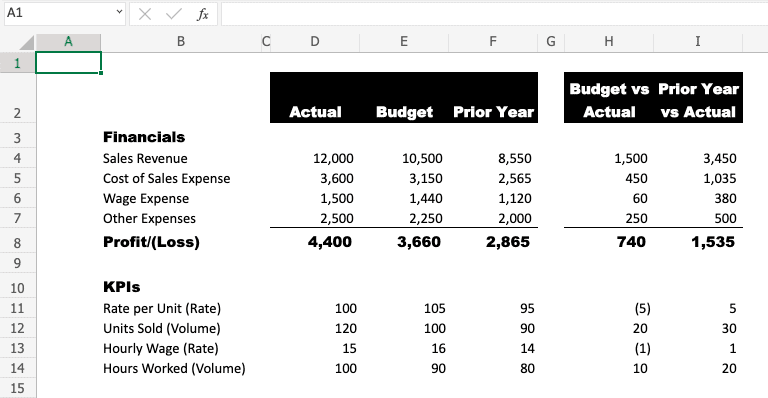
From the completed P&L, we will add a table to calculate the rate and volume variances. Make sure to label the components for easier analysis. Once you have created the table, add in the rate and volume formulas. The KPI section is helpful as it already does some of the math for us.
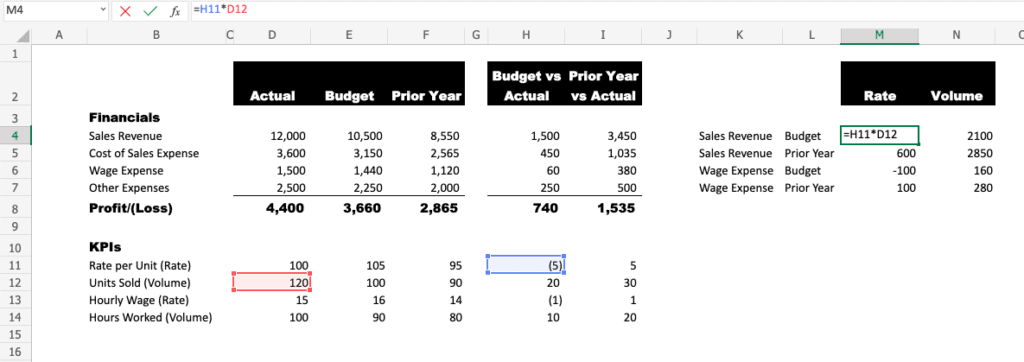
Some insights immediately jump out once the rate and volume analysis is complete. Wages were higher than budget, but it was actually driven by hours worked since the wage rate was favorable. Sales volume is having a larger impact than sales rate compared to both budget and prior year.
This insight can help improve future forecasting and allow operations leadership to focus on the right, controllable business drivers.
Frequently Asked Questions
Where Can I Find Data For Variance Analysis?
Data for variance analysis can be found in a variety of sources. This includes financial statements, customer data, sales and marketing data, operational metrics, and employee performance records. It is important to use reliable sources that accurately reflect the company’s performance.
What Are The Benefits Of Variance Analysis?
The benefits of variance analysis include improved visibility into the drivers of results and more effective decision-making. By analyzing both rate and volume drivers, businesses can identify variances between actual performance and expectations or goals. With the right tools in place, you can ensure that your organization is properly assessing performance with accuracy and confidence.
Are There Any Challenges To Variance Analysis?
Variance analysis can be challenging due to the complexity of data sources and the calculation of rate and volume drivers. It is important to ensure that data is accurate and up-to-date in order for the analysis to be reliable. Also, it’s important to recognize that variance analysis can be subjective and therefore open to interpretation. It is essential to keep an unbiased perspective when analyzing performance.
Are There Any Best Practices For Variance Analysis?
When performing a variance analysis, it is important to use reliable sources of data and to have a clear understanding of the rate and volume drivers. It is also important to have proper controls in place, such as budget/forecast accuracy, data validation checks, and periodic performance reviews. Lastly, it is important to ensure that you are adhering to organizational policies when analyzing performance results.
Can I Do Variance Analysis With Rate, Volume, and Mix?
Yes, you can do variance analysis with rate, volume, and mix. This type of analysis is used to identify which components are having the most significant impact on business performance. By analyzing all three variables, businesses can gain insights into how their different products or services are performing in comparison to each other as well as to budgeted targets. Mix variance is handy for understanding the overall performance of a business, as it allows you to look at various components in combination. With the right tools and data sources, you can effectively analyze rate, and volume, and mix together to gain meaningful insights into your organization’s performance.
Can I Automate Variance Analysis?
Yes, variance analysis can be automated with Forecasting & Optimization software. This type of software allows you to quickly and easily detect, monitor, and analyze trends in your data. It can also help you identify root causes for variances between actual performance and expectations or goals.
With automated analysis, businesses can gain visibility into how their operations are performing, allowing them to make informed decisions and optimize their operations. Automated analysis also helps to streamline the process of variance analysis, making it simpler and more efficient for businesses.
Have any questions on variance analysis using rate and volume? Are there other topics you would like us to cover? Leave a comment below and let us know! Make sure to subscribe to our Newsletter to receive exclusive financial news right to your inbox.