Forecasting Using Rate and Volume
Do you want to make better business projections without having to do complex statistical analysis? Rate and volume forecasting is a simple but reliable method to help you develop accurate projections. It uses a simple formula and inputs your business already has on hand. You can use this method to project Revenues, Expenses, and even KPIs – all without needing any special knowledge or skills!
Imagine being able to quickly adjust your inputs for different scenarios in order to evaluate the best options for your business. With rate and volume forecasting, it’s easy to get insights into what will work best for you – no matter your industry or sector.
Read our blog post now to learn more about how rate and volume forecasting can help improve your decision-making process!
What Is Forecasting?
Forecasting is a predictive tool for anticipating future outcomes based on past or current data. It’s a powerful way to plan for the future and make better decisions by identifying trends and predicting customer behavior, sales, expenses, and more. Predictive analytics helps businesses plan for the future by making informed decisions and preparing for various scenarios.
What is Rate and Volume Forecasting?
Rate and volume forecasting, also known as driver-based forecasting, is a technique that uses simple formulas to project an outcome based on two factors. By varying the rates and volumes (drivers), you can project Revenues, Expenses, and even KPIs. The great thing about this is that we do not need statistical analysis or linear regression. Also, you can easily adjust your inputs to run different scenarios for evaluation.
Rate and Volume Formula
rate x volume = output
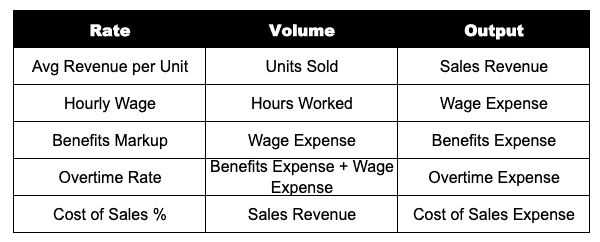
Examples of Rate and Volume Pairs (Drivers)
Why Rate And Volume Forecasting Matters
Rate and volume forecasting helps businesses make better decisions on allocating their resources. It not only allows them to understand the impact of different rates and volumes on their business, but it also provides insights into which scenarios will work best for them down the line. Additionally, it helps identify potential risks or opportunities so businesses can plan accordingly.
Even better, using rate and volume for forecasting makes it easy to use rate and volume for variance analysis since your business is already tracking the drivers.
The Forecasting Process
Let’s walk through an example where we will forecast compensation expenses using rate and volume. We will use three different rate and volume calculations for this forecast. The first calculation will be an input for the second two calculations.
Step 1: Define the Calculations
Our goal is to forecast compensation expenses. For this exercise, let’s assume compensation has three parts. First, hourly wages paid to employees. Second, overtime when the employees work over 40 hours. Lastly, benefits paid to the employees (payroll tax, 401k, and medical).
We will need to calculate each expense separately. Here are the formulas we will use:
Hourly Wage x Hours Worked = Wage Expense
Overtime Rate x Wage Expense = Overtime Expense
Benefits Markup x (Wage + Overtime Expense) = Benefits Expense
Wage Expense + Overtime Expense + Benefits Expense = Compensation Expense
Step 2: Gather Assumptions
Hourly Wage
You can use historical trends or target hourly rates depending on the age of the business. We will use a flat assumption of $15.00, the minimum wage in many areas.
Hours Worked
Hours worked tend to fluctuate across the year. Similar to the hourly wage, you can use historical trends or expected hours depending on the age of the business. Keep in mind seasonal demand which can impact both hours worked as well as overtime.
Overtime Rate
In our example, the overtime rate is the overtime dollars in a period divided by the hourly wages in a period. This assumption considers the 50% premium paid and the number of eligible hours to simplify the calculation. Depending on the data available, overtime hours and overtime premiums could become their own rate and driver inputs.
Benefits Markup
For the benefits markup, we will assume you pay payroll taxes, 401k, and medical benefits. For 2021, payroll taxes are 7.65% based on IRS Publication 15. Next, 401k would be the percent allowed under your employer plan; we will assume 4% in this case. Finally, Medical benefits are the annual medical premiums paid divided by expected annual wages. We will assume 13.35% to bring the benefits markup to 25%.
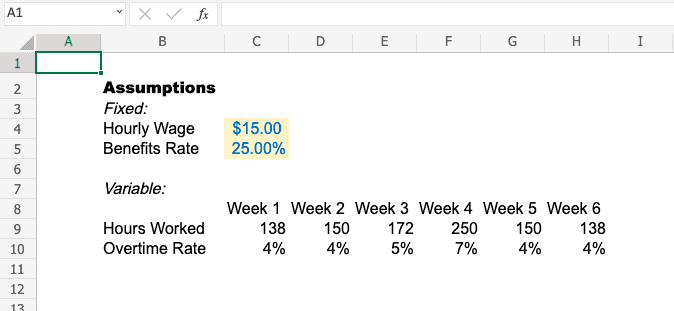
Step 3: Build an Assumption Table
Now let’s move into Excel and start working through the forecast. First, you must build an assumption table to organize your inputs. Some of the inputs might change across our forecasting period. With that said, you need to decide if an assumption is fixed or variable since some of the inputs might change across our forecasting period. In this example, we will assume that hourly wage and benefits markup are fixed. We will then assume hours worked and overtime rate are variable.
Step 4: Generate the Forecast

Tips And Tricks
Finding Data And Assumptions
Forecasts are only as good as the data and assumptions you put into them. So where can you find solid data? If you have an existing business, your financial system is the first place to look. Historical data is one of the best inputs to a forecast. You can also work with your operations teams to understand what it will take to deliver a certain level of performance.
You will have to dig a bit deeper for a new business without historical info. Economic data and market research are your best bets. This can include digging into resources like the Consumer Product Index (CPI) for inflation or studying your competitors.
Step Back And Do A Gut Check
As you get into the weeds of your forecast, it is important to step back and ask yourself, “Does this make sense?” Think about how the forecast looks year-over-year and sequentially. Do you have the capacity and workforce to deliver the forecast? Do the trends seem reasonable, or are there unusual outliers in the forecast?
It is critical to sanity-check your work and ensures you put out a great product
Build For the Future
When working on a forecast, do yourself a huge favor and build it for the future. Well, obviously, a forecast is for the future, but I mean the model itself. If you are running a forecast today, you are likely to run the forecast again. Ensure the model is dynamic enough to pull in new actuals and roll forward for future periods. Avoid hardcoding, and try to link everything up to data tables. Make it clear which periods and cells are actuals and which are forecast.
Setting up this may take some extra time, but it will pay off.
Frequently Asked Questions
Q: What if I lack data for rate and volume forecasting?
A: If you do not have enough historical data, it’s recommended that you do a sensitivity analysis to understand how different scenarios might affect your forecasted results. This will help you to better understand the risks and opportunities associated with various rate and volume combinations.
Q: What if I need to forecast other expenses?
A: Other expenses can be forecasted using a similar process. You will want to identify and include the key inputs that drive each expense in your assumption table. Then, you can develop formulas or use historical trends to generate forecasting scenarios. Finally, you should consider doing sensitivity and scenario analysis
Q: How often should I update my forecast?
A: Generally speaking, you should update your forecast at least once a month to accurately reflect the business’s current conditions. Make sure to track metrics like revenues, customer count, and other performance indicators that can impact your expenses. Keeping tabs on these key metrics will help you adjust your forecast.
Quick Recap
Rate and volume forecasting is a simple but effective way of making better business decisions. It uses a straightforward formula and the inputs your business already has on hand to provide insights into the best options for success. Its easy adjustability allows you to quickly evaluate different scenarios – making it an invaluable tool for any business looking to plan for the future.
Have any questions on forecasting using rate and volume? Are there other topics you would like us to cover? Leave a comment below and let us know! Remember to subscribe to our Newsletter to receive exclusive financial news in your inbox.