
The Easiest Profit And Loss Statement Excel Template
Hello there, finance adventurers!
I remember the first time I tried to make sense of a profit and loss statement. It felt like I was trying to decipher hieroglyphics without the Rosetta Stone. The numbers swam before my eyes, and terms like ‘revenues’, ‘expenses’, and ‘net income’ seemed as alien as quantum physics. But guess what? I survived, and you will too!
In this article, we’re going on a journey together to conquer the mighty profit and loss statement (also known as income statement) – all within the friendly confines of Excel. We’ll start by understanding what a P&L statement is and why it’s vital to your business. Then, we’ll dive into preparing your data, followed by a step-by-step guide to building your very own P&L statement. By the end, you’ll have the power to analyze your P&L statement and make informed decisions about your business.
Key Takeaways
Creating a profit and loss statement in Excel involves several steps. First, open a new Excel spreadsheet and label the first four columns as ‘Revenue,’ ‘COGS,’ ‘Expenses,’ and ‘Net Profit.’ Under ‘Revenue’, list all your sources of income and their respective amounts. For ‘COGS’ and ‘Expenses,’ list down the direct costs related to producing your goods and all other costs, respectively. Finally, calculate the net profit by subtracting the sum of ‘COGS’ and ‘Expenses’ from ‘Revenue.’
Understanding Profit And Loss Statements
Remember when we were kids playing with our piggy banks? We’d drop in coins (and sometimes notes if we were lucky), then we’d take some out to buy candy or toys, and finally, we’d shake that piggy bank to hear the satisfying jingle of what was left. Well, a profit and loss statement is pretty much like your grown-up piggy bank.

In essence, profit and loss statements (or income statements, as they are often called) are a summary of the money coming into your business (like those coins you saved), the money going out of your business (like buying that candy), and what you’re left with at the end (that satisfying jingle). But instead of coins and candy, we’re talking about revenues from sales, costs of goods sold, expenses, and hopefully, a nice net profit.
Let’s break down the profit and loss statement format:
Revenues:
This is the total amount of money your business earns from its main operations – think of it as the starting number of coins in your piggy bank.
Cost of Goods Sold (COGS):
These are the direct costs of producing the goods or services your business sells – like the cost of the candy you bought with your piggy bank money.
Business Expenses:
These are the other expenses incurred by your business that aren’t directly tied to a specific product or service, such as rent, salaries, marketing, and utilities. Imagine these as other stuff you bought, like stickers or comic books.
Net Profit:
Finally, this is the business income that’s left over when you subtract your COGS and expenses from your revenues. It’s the jingle left in your piggy bank, the part that makes you smile.
Why a P&L Statement is Vital to Your Business
Understanding your profit and loss statements is like having a financial health check-up. It tells you if your business is profitable or not, where your money is going, and where you could make improvements. It can also help you predict future business performance by tracking trends and identifying areas for cost-cutting or growth.
So, it’s not just a bunch of numbers – it’s a story about your business’s performance, a tool that helps you make informed decisions to grow and thrive in your entrepreneurial journey. And trust me, that’s a story worth understanding.
Before We Start: Preparing Your Data
Data collection is like baking a cake. If you use rotten eggs or forget the baking powder, your cake might end up flat, tasteless, or worse, make someone sick! Similarly, inaccurate data can lead to misinformed decisions that could harm your business. So, just like we’d carefully measure our ingredients for that perfect chocolate cake, we need to ensure our financial data is accurate, up-to-date, and complete.

Now, onto organizing our ingredients. Here are some tips to keep your data tidy:
- Keep it Consistent: Use consistent categories and labels across all your data. If you call it ‘revenue’ in one place and ‘sales’ in another, you’re setting yourself up for confusion.
- Time Periods Matter: Make sure you’re comparing apples to apples. If you’re looking at monthly profit, ensure all your data is broken down by month.
- Keep it Simple: Don’t go overboard with too many categories. Stick to what’s relevant to your business and your P&L statement.
Step-by-Step Guide to Building a Profit & Loss Statement in Excel
Alright, folks, it’s time to roll up our sleeves and get down to business. We’re going on an Excel adventure together, and I promise it’ll be more fun than the time you tried to assemble flat-pack furniture without the instructions!
Free Profit And Loss Statement Excel Template
Make sure to download our free profit and loss statement template to follow along with the examples and to use in your own business:
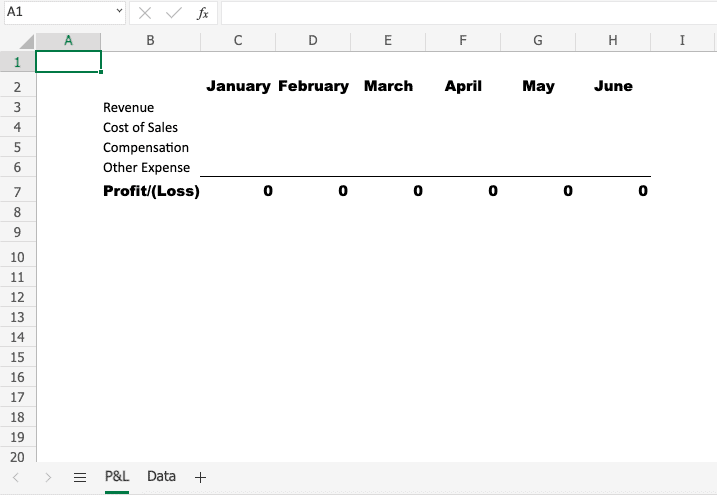
Step 1: Setting Up Your Excel Workbook
Imagine your Excel workbook is like your kitchen. Before we start baking our financial cake, we need to set everything up in our profit and loss template. Create a new Excel spreadsheet and label the first four rows as ‘Revenue’, ‘Cost of Sales’, ‘Compensation’, ‘Other Expenses’, and ‘Profit/(Loss)’.
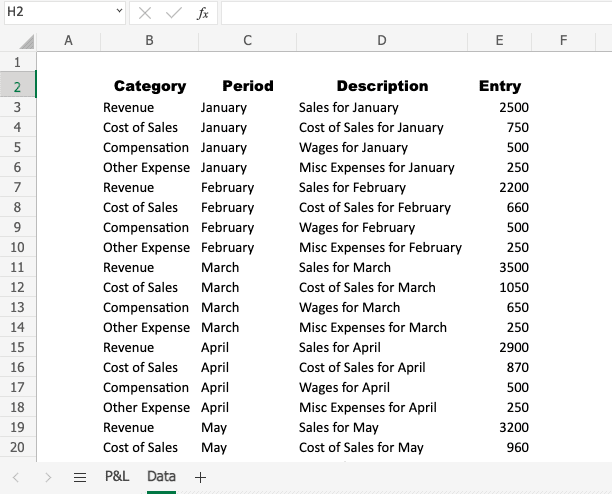
Step 2: Inputting Revenue And Expense Data
Now, let’s start filling our baking bowl. In the ‘Revenue’ column, list all your sources of income. For instance, if you run a bakery, you might have ‘bread sales’, ‘cake sales’, ‘pastry sales’, etc. Next to each item, fill in the respective amounts. Remember, accuracy is key here – no one likes a cake that’s too sweet or too bitter!
Next, let’s tackle the ‘COGS’ and ‘Expenses’ columns. Under ‘COGS’, list down the direct costs related to producing your goods. In our bakery example, these would be things like flour, eggs, sugar, etc. For ‘Expenses’, write down all other costs like rent, salaries, utilities, and marketing. Be thorough – even the tiniest sprinkle can make a difference to our cake!
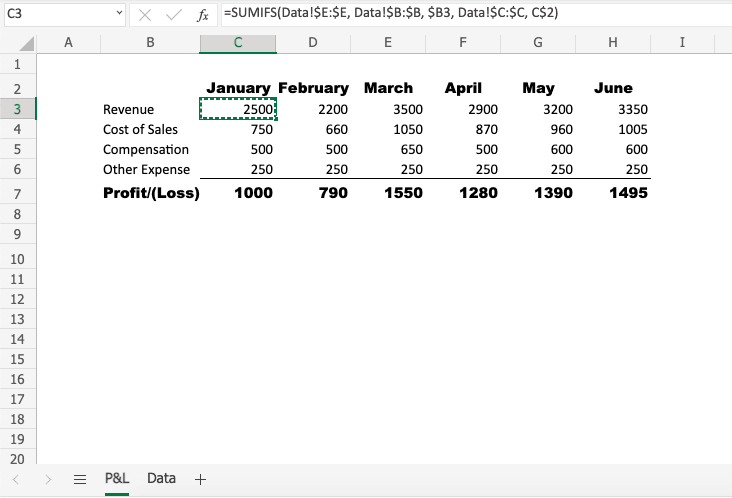
Step 3: Pulling Revenue And Expenses Into P&L
Now, we need to use SUMIFS to pull our data table into the P&L. You will use the type of revenue or expense as well as the month as the criteria.
Step 4: Calculating Net Profit
Here comes the big moment – it’s time to calculate our net profit. This is like the final taste test of our cake. In Excel, subtract the sum of ‘COGS’ and ‘Expenses’ from ‘Revenue’. The result is your net profit. If the number is positive, congrats! Your business cake is deliciously profitable. If it’s negative, don’t worry. Side note, gross profit is like the first taste test – it shows how much profit you made before accounting for expenses.
You can also check items like profit margin % and net income in order to get a better understanding of the financial health of a company. Profit margin % is the percentage of revenue that turns into profit after all expenses are accounted for. A higher profit margin % indicates that a company is able to generate more from its sales.
Common Mistakes and How to Avoid Them
Before we wrap up, let’s go over some common mistakes on profit and loss statements:
- Mixing Up Categories: Remember, ‘COGS’ are direct costs related to your goods or services, while ‘Expenses’ are other costs. Don’t mix them up!
- Overlooking Small Costs: Every penny counts in a small business. Whether it’s a small monthly subscription or occasional maintenance costs, make sure to include them all.
- Inaccurate Data Entry: Double-check your numbers. An extra zero can turn a profitable month into a loss!
Analyzing Your Profit & Loss Statement
We’ve made it, my friends! We’ve baked our financial cake, and now it’s time to taste it. But what do all these financial documents mean? How do we know if our cake is a success or if it needs a bit more sugar or a little less salt? Let’s find out together.
Reading your P&L statement is like reading a recipe. At first glance, it might seem like a list of random ingredients, but as you look closer, you start to see how everything connects.
Your ‘Revenue’ is the base of your cake – it’s what everything else is built upon. Your ‘COGS’ and ‘Expenses’ are the ingredients that go into making the cake. And your ‘Net Profit’? That’s the final taste of your cake, telling you whether it’s sweet (profitable) or needs a bit more work.
So, what can these numbers tell us about our business? Quite a lot, actually!
High ‘Revenue’ but low ‘Net Profit’? Maybe your ingredients (COGS) are too expensive, or you’re using too many (high expenses).
Low ‘Revenue’ but high ‘Net Profit’? You’re running a lean, mean baking machine!
Negative ‘Net Profit’? Don’t despair. It’s a sign that something needs tweaking – maybe we need to sell more cakes or find cheaper ingredients. And remember, even the most successful bakers have baked a few flops along the way!
Frequently Asked Questions
How do I create a free profit and loss statement?
You can easily create a free profit and loss statement using our free profit and loss statement template for Excel or any other spreadsheet software. The process involves downloading the workbook above, inputting your revenue data, adding your cost of goods sold and expenses, and finally calculating your net profit.
What is an example of a simple profit and loss statement?
An example of a simple profit and loss statement would include sections for revenue (like sales of products or services), cost of goods sold (like raw materials or direct labor costs), and operating expenses (like rent or salaries). The bottom line would show the net profit or loss, calculated by subtracting total costs and expenses from total revenue.
Does Excel have a Profit and Loss statement template?
Yes, Excel does offer a Profit and Loss statement template. You can find these by going to File > New and searching for “profit and loss” in the template search bar. These templates can be a good starting point if you’re new to creating P&L statements.
What is the formula for profit and loss in Excel?
The formula for calculating profit and loss in Excel is `=Revenue – (COGS + Expenses)`. Just replace ‘Revenue’, ‘COGS’, and ‘Expenses’ with the cell references where you’ve entered these values.
Does Word have a profit and loss template?
While Word is not typically used for financial statements like a P&L, it does offer some basic templates for business financials. However, Excel or other spreadsheet software would be more suitable for creating a detailed and dynamic P&L statement.
Step 3: Write Formulas to Fill Out the P&L
Lastly, you will write formulas to lift data from the Data tab to the P&L tab. In this case, I would recommend SUMIFS() as you will have more than one variable (revenue/expense and period) and you may have multiple entries per intersection.
Have any questions on how to create a Profit and Loss statement in Excel? Are there other topics you would like us to cover? Leave a comment below and let us know! Make sure to subscribe to our Newsletter to receive exclusive financial news right to your inbox.