A Step-By-Step Guide To Rolling Forecasts
Picture it: I was fresh out of grad school, brimming with theoretical knowledge but woefully short on real-world experience. The first time I encountered the term “rolling forecasts,” I was at a small startup that operated more like a high-speed train than a traditional business. The CFO, a wily veteran with a penchant for dad jokes and financial wizardry, introduced me to the concept.
“Think of it as a magic trick,” he said, his eyes twinkling with mischief. “Except instead of pulling a rabbit out of a hat, you’re conjuring up financial predictions out of thin air.” I remember chuckling and feeling utterly baffled at the same time.
Now, don’t worry. Rolling forecasts are not actually magic, and you don’t need a wand or a dusty old spellbook to use them. In fact, they’re a practical tool that can bring clarity and agility to your business finances.
In this article, we’re going to demystify rolling forecasts. No smoke and mirrors, just straightforward advice and clear explanations. Whether you’re a seasoned pro looking to refresh your skills or a newbie trying to make sense of it all, this guide will help you understand and effectively use rolling forecasts in your business.
Quick Highlights
A rolling forecast is like your favorite playlist on shuffle—you never quite know what song will play next, but you’re constantly updating and adjusting based on what’s coming up. In business terms, it’s a financial forecast that rolls forward each time period (say month, quarter, or year).
Why do we love them? Well, I’m glad you asked! Rolling forecasts are all about flexibility and adaptability. They free us from the shackles of static annual budgets and let us respond in real-time to changes in the business environment. Think of them as your business’s nimble-footed dance partner, always ready to twirl with the tunes of the market!
What are Rolling Forecasts?
Rolling forecasts are kind of like your favorite streaming series. Just when you think you’ve reached the end of the season, surprise! A new episode pops up, extending the narrative and keeping you engaged. In the world of finance, rolling forecasts are the fresh episodes that continuously extend your financial planning horizon, enabling you to adapt to changing circumstances and make informed decisions.
Now, you might be wondering how this differs from traditional budgeting methods. Let’s compare it to watching a DVD box set (remember those?). With a DVD, you have a fixed number of episodes – once you’ve watched them all, that’s it. You’re done. This is akin to static budgeting, where you prepare a budget for a set period (usually a year), and once that period is over, so too is your budget.
Rolling forecasts, on the other hand, are more dynamic. They’re continually refreshed, extending a certain period into the future—just like your streaming service adding new episodes regularly. This allows you to respond to changes in real-time, adjusting your financial plans based on recent trends and data. So, while traditional budgeting can feel like you’re stuck re-watching the same old DVD, rolling forecasts are like enjoying a constantly updating streaming series.
That’s the beauty of a rolling forecasting process – they keep your business finances flexible, current, and ready for whatever plot twists may come your way!
Benefits Of Rolling Forecast Method
- Increased accuracy: Rolling forecasts provide more accurate predictions than traditional forecasting methods. By regularly reviewing and adjusting predictions, organizations can better anticipate future trends and plan accordingly.
- More agile planning: With rolling forecasts, organizations have the flexibility to adjust their plans as needed in response to changing market conditions or customer needs. This helps ensure that your business remains prepared for whatever lies ahead.
- Improved decision-making: Organizations can use rolling forecasts to identify opportunities for growth and make informed decisions about investments and other strategic initiatives. This helps them maximize profitability, improve financial outcomes, and minimize risks in the long term.
Disadvantages of Rolling Forecasts
- Time-consuming: The continuous cycle of re-evaluating past predictions can be time-consuming and challenging to keep up with.
- Data collection challenges: Accurate predictions require reliable data, which can sometimes be difficult to obtain. Organizations must ensure that they are collecting the right information in order to make accurate forecasts.
- Expense: Rolling forecasts require more resources and expertise than traditional budgets, which can be expensive. Organizations must be willing to invest in the necessary tools and personnel to ensure accurate predictions.
Rolling Forecast Vs Traditional Budgeting
Rolling forecasts are different from a traditional budgeting and planning process in several key ways.
- Flexibility: Rolling forecasts allow organizations to adjust their plans as needed, rather than adhering strictly to a predetermined annual budget. This helps ensure the organization is agile and can respond quickly to changing market conditions.
- Forecasting focus: While traditional budgeting focuses on planning for the future, rolling forecasts emphasize predicting future trends and outcomes. This allows organizations to anticipate potential opportunities and risks instead of simply allocating resources based on past performance.
- Continuous improvement: Rolling forecasts provide continuous feedback on predictions, which can help organizations identify areas of improvement and make adjustments accordingly. Traditional annual budgets lack this kind of flexibility, so it may be more challenging to make changes and improve performance.
How to Create Rolling Forecasts: A Step-by-Step Guide
You’ve got this! Implementing rolling forecasts may seem like a daunting task, but I promise it’s not as tricky as assembling that flat-pack furniture from IKEA. With a little patience and the right steps, you’ll be forecasting like a pro in no time. Let’s break it down:
Step 1: Get The Organization Onboard
Before you start building a new rolling forecast process, getting the entire organization onboard is critical. And not just your finance team. Your operations, marketing, and sales team should be involved too. That way, all business units will understand the key drivers of your business’s success and have the exact expectations regarding what level of accuracy is required from forecasting models.
Step 2: Identify Your Time Horizon
This is like planning a road trip. How far do you want to go? A day trip, a week-long adventure, or a month-long expedition? In finance terms, this means deciding how far into the future you want your forecast period to extend. This could be quarterly, bi-annually, or annually, depending on your business needs.
Step 3: Choose Key Variables
Think of these as your travel essentials. What do you need to pack for your journey? In the world of rolling forecasts, these are the key performance indicators (KPIs) that will most impact your financial outcomes. This might include sales volumes, operating costs, or market trends. Check out our article on driver based forecasting to learn more.
Step 4: Collect Data
Now, we’re fueling up the car. This data is your gas, powering your forecast engine. You’ll need historical data to feed into your rolling forecast model, as well as any relevant external data—like economic indicators or industry trends.
Step 5: Create Your First Forecast:
Buckle up, we’re hitting the road! Using your data, you can now generate your initial forecast. There are various techniques you can use, from simple spreadsheets to sophisticated software. What’s important is that your forecast provides clear, actionable insights for decision-making.
Step 6: Adjustments And Scenario Planning
Once you have your model up and running, it’s vital to monitor its progress regularly and make necessary adjustments when needed. By paying close attention to how well your forecasts align with actual performance, you can identify any potential issues and take the right steps to correct them. Additionally, running regular scenarios will allow you to understand how changes in specific inputs or assumptions may affect your financials.
The goal of successful rolling forecasts is always to project future performance as accurately as possible.
AI And Predictive Analytics

Digital Finance is playing an increasing role in the work of finance teams. By leveraging advanced technologies such as machine learning and artificial intelligence (AI), businesses can now create more accurate forecasts considering historical data and future trends. AI-driven predictive analytics solutions can also help uncover hidden insights into customer behavior, market dynamics, and more, allowing finance teams to make better decisions and drive growth.
Ultimately, the best way to ensure your rolling forecast process is accurate and efficient is by leveraging the right technology – whether it’s Excel or a specialized forecasting solution. Doing so can save time and resources while giving yourself the tools to make better decisions.
Example: Creating A Rolling Forecast In Excel For A Coffee Shop
Let’s roll up our sleeves and dive into a real-life example of how you can create a rolling forecast for your business using good ol’ Excel. This will be like baking your favorite cake – it might seem complicated at first, but once you’ve got the recipe down, it’s a piece of cake!

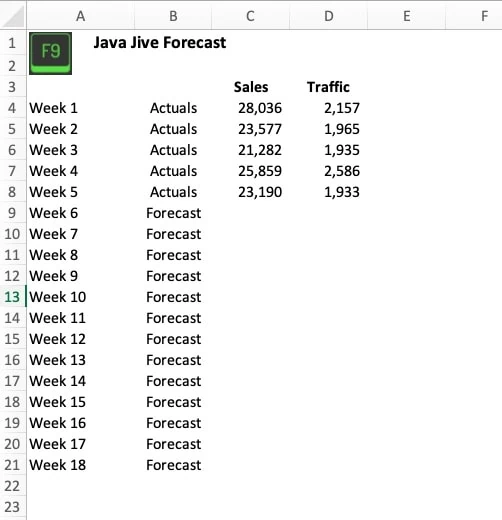
Let’s say you’re running a small coffee shop, “Java Jive”, and you want to forecast your sales for the next quarter.
Make sure to download our Excel workbook so you can follow along.
Here’s how you can do it:
1. Identify Your Time Horizon: We’re going on a 3-month journey here, so we’re looking at forecasting your sales for the next quarter.
2. Choose Key Variables: In our case, this could be daily coffee sales and customer traffic.
3. Collect Data: Gather data on these variables for the past weeks. You might pull your sales data from your point-of-sale system, count customer traffic manually, and note any seasonal trends (like an uptick in iced coffee sales in summer).
4. Create Your First Forecast: Open up Excel and let’s get cracking!
- Step 1: Enter your historical data in one column. Let’s say Column A has dates, and Column B has corresponding coffee sales.
- Step 2: Use Excel’s FORECAST.LINEAR function to predict future sales. This function uses your existing data to calculate a straight line that best fits your data, and then uses this line to forecast future values. Let’s say you want to predict sales for next week, you’d type
=FORECAST.LINEAR(traffic, historical_sales, historical_traffic). Replacetraffic with the cell containing next week’s traffic,historical_saleswith the range of cells containing your past sales, andhistorical_trafficwith the range of cells containing corresponding traffic. - Step 3: Drag the fill handle (the little square at the bottom-right of the cell) down to copy this formula for all future dates in your forecast horizon.
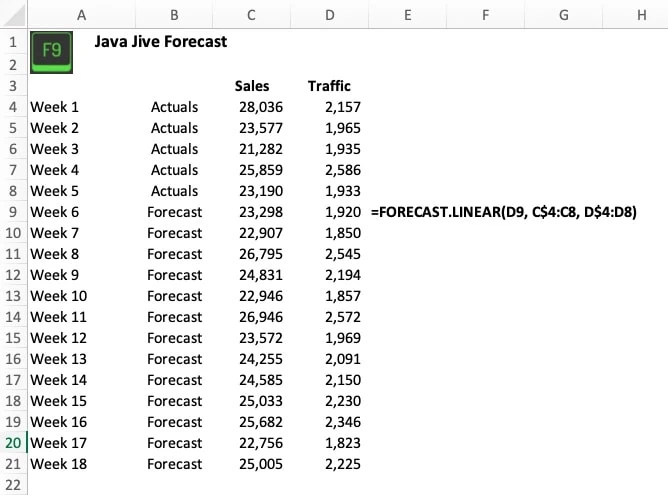
5. Update Regularly: Now, here comes the rolling part. Each day, add your actual sales to your historical data and push your forecast horizon one day further into the future. This way, your forecast is always ‘rolling’ forward.
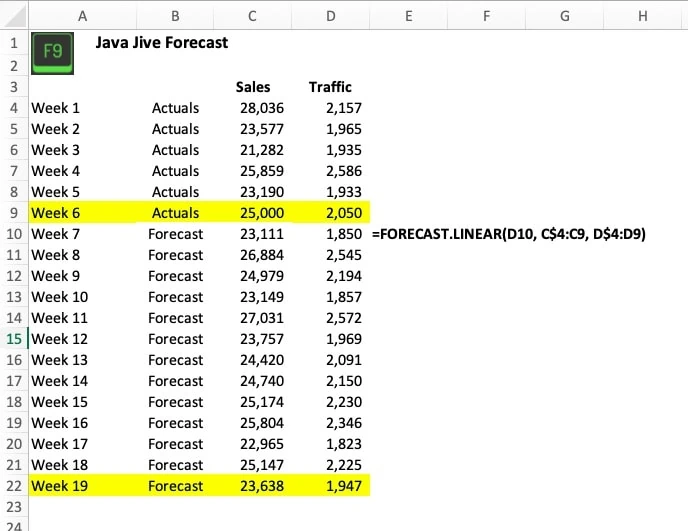
And voila! You’ve got your very own rolling forecast in Excel. Remember, it’s like learning to ride a bike—the first few times might be wobbly, but once you get the hang of it, you’ll be cruising along in no time. Happy forecasting, and may your coffee sales be ever on the upswing!
Quick Recap
Well, my friends, we’ve journeyed together through the ins and outs of rolling forecasts, like explorers navigating a fascinating new landscape. Sure, we’ve encountered a few bumps along the way—like the cost and resource-intensive nature of these forecasts—but let’s not forget the breathtaking views we’ve also enjoyed: the flexibility, adaptability, and dynamic insights that rolling forecasts can offer.
Remember when you first learned to ride a bike? It was tough at first, right? But with time and practice, you got the hang of it and oh, the freedom it brought! That’s what rolling forecasts are like. They might seem challenging initially, but once you master them, they can truly liberate your business from the constraints of static budgeting.
So, why not give it a shot? Try creating your own rolling forecasts. Experiment with them, tweak them as you go along, and see how they can help your business navigate through the ever-changing market dynamics. You’ve got the knowledge, you’ve got the tools, and most importantly, you’ve got the spirit.
Frequently Asked Questions
What Is The Difference Between A Normal Forecast And A Rolling Forecast?
A normal forecast involves predicting a single result (e.g., sales figures for the next quarter), while a rolling forecast updates this prediction continuously as new data is received. This ensures that your projections are always up-to-date and consider any market or company performance changes over time.
What Are The Benefits Of Rolling Forecasting?
A rolling forecast offers numerous advantages, including improved accuracy due to its reliance on current data, better decision-making due to more reliable predictions, and better visibility into future trends for planning purposes. Additionally, it improves agility by allowing you to quickly adjust course if needed in response to changing conditions.
How Often Should I Update My Rolling Forecast?
This will depend on your business and the type of data you are forecasting. Generally, it’s a good idea to update your projections at least once a month or whenever significant new information is available. Additionally, it may be helpful to periodically run scenarios to test how different inputs or assumptions might affect the outcome.
Ultimately, having an automated system in place for rolling forecasting can help ensure that you have accurate numbers to rely on when making decisions about the future of your business. With consistent monitoring and periodic updates, you can stay one step ahead of any sudden changes in the market or performance of your company.
What Are The Features Of A Rolling Forecast?
A rolling forecast typically includes features such as trend analysis, scenario modeling, and forecasting algorithms.
Trend analysis enables you to track and analyze trends in the data over time to make more accurate predictions. Scenario modeling allows you to run different scenarios to see how different conditions or assumptions may affect the outcome of your forecasts. Finally, forecasting algorithms use historical information and statistical models to generate more accurate predictions.
By combining these features with up-to-date data, a rolling forecast can provide an invaluable tool for managing business performance.
How Is A Rolling Forecast Different From A Static Budget?
A rolling forecast is distinct from a static budget in several ways. Unlike a traditional budget, which remains unchanged over time, a rolling forecast updates automatically as new information becomes available. Additionally, a rolling forecast allows for more accurate predictions of future performance and enables you to test different assumptions to see how they may affect the outcome. Static budgets, however, do not provide these benefits and can lead to inaccurate projections that may hinder decision-making.
Have any questions? Are there other topics you would like us to cover? Leave a comment below and let us know! Remember to subscribe to our Newsletter to receive exclusive financial news in your inbox.