
An Easy Way To Forecast Cost of Goods Sold
Are you a business owner looking to better manage and forecast cost of goods sold?
We have the perfect solution for you! Our easy-to-use forecasting method will help you accurately predict and plan for future costs. With our simple approach, you can quickly identify potential risks and opportunities that may arise in the near future.
You’ll be able to make smarter decisions with confidence, knowing that your forecasts are based on reliable data. Plus, our intuitive system allows you to easily adjust your forecasts as needed so that they remain accurate over time.
Read on to learn about the easy-to-use percentage of sales revenue method.
What Is Cost Of Goods Sold?
Cost of goods sold (COGS) is a measure of the total cost associated with producing and selling your products. It includes all expenses related to purchasing materials, labor, and other overhead costs needed to manufacture or acquire products. COGS is one of the main components of a company’s income statement and can be used to make long-term decisions about production and pricing strategies.
Why Does Forecasting Cost Of Goods Sold Matter?
Forecasting COGS is a critical part of financial forecasting for any business for two main reasons. First, COGS is a key component of gross profit. Forecasting future COGS allows businesses to accurately predict future profits. Second, forecasting COGS can help businesses budget for inventory and make other strategic decisions.
By accurately predicting future COGS, businesses can ensure that they are pricing their products and services correctly and are not over-or under-investing in inventory.
Breaking It Down
When you work on any forecast, you need to step back and break the forecast down into pieces. What are the drivers behind the forecast?
The percentage of sales revenue method is a simple way to predict future COGS. Most of the time, it will suffice for small and medium businesses. This approach uses past figures of Cost of Goods Sold (COGS) over sales revenue to calculate percentages. These percentages can then be used to predict future COGS.
The Forecasting Process
Step 1: Determine What You Need to Forecast
We’ll need to predict the following components in order to produce a COGS forecast using the percentage of sales method:
- Sales Revenue
- Cost of Goods Sold %
- Growth Rates
Step 2: Collect Inputs and Assumptions
For each of the components from step 1, you will need to collect the inputs and assumptions behind them. For example, sales revenue may have its own forecast that you can collect from the sales planning team.
If you are a new business, you may need to estimate things like Cost of Goods Sold % or growth rates based on competitors. If you are an existing business, you might want to consider historical data.
Step 3: Layout the Forecast Model
Once you have determined what to forecast and collected the inputs, it is time to start building a model. Forecasting models can be as simple or as complex as you want them to be. For example, if we’re forecasting COGS for one store with many years of historical data, the spreadsheet for your model would be really simple.
On the other hand, if you are forecasting COGS for 1,000 stores across a country, you will need a complex model with more details.
Step 4: Run and Adjust the Forecast
Once your model is set up, you simply need to run it and adjust the inputs as needed. You will want to do this on a regular basis, especially if your business is growing or changing. Forecasting is not a one-time event; it should be done regularly to ensure that your numbers are accurate.
Step 5: Review and Summarize
You should look at your forecast results to ensure they make sense and summarize them in a way that works for your business. For example, if you are forecasting COGS on a monthly basis, you may want to do quarterly and annual views. If you are forecasting by store, you may want to view by region. You may even want to look at trend views to ensure there aren’t any outliers.
Let’s Walk Through An Example
Excel Workbook
Forecast Cost Of Goods Sold For A Restaurant
Let’s walk through a basic COGS forecast for a single restaurant location. This is a fairly new restaurant, so we only have a few months of historicals.
First, let’s lay out what we need to forecast. In this case, we have six months of actuals data. We want to forecast the following six months to look at a full year. Our forecast P&L looks like this:

Next, let’s lay out the drivers behind this forecast. Under Forecasting Process above, we laid out the following drivers:
- Sales Revenue – This is an input we will need from a separate sales forecasting process
- Cost of Goods Sold % – The cost of goods sold as a percent of revenue
- Growth Rates – Any increase (or decrease) in cost of goods sold that wouldn’t be captured in historicals. This can be higher than average inflation or new supplier contracts
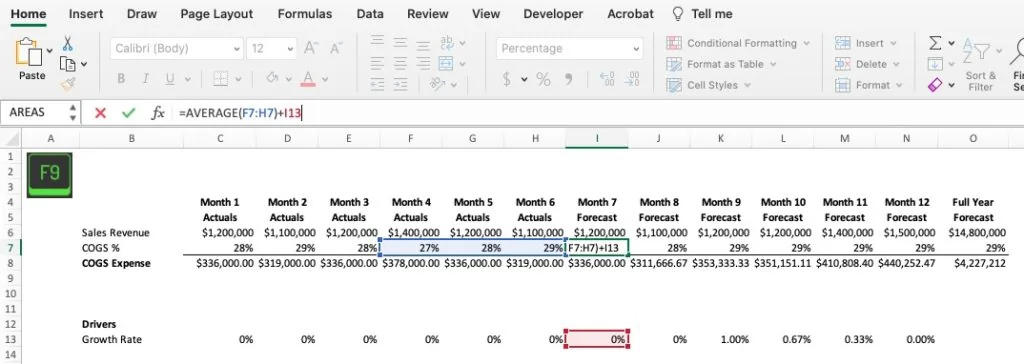
Laying out the drivers expands our forecast like this:

For sales revenue, we will lift this into the file from a separate sales forecasting process. For COGS %, we will use a 3-month rolling average. We will incorporate growth rates into the file by adding them into the average. Let’s assume that in month 9 there is a one percent increase from a supplier raising prices. Keep in mind that to adjust a rolling average, you will need to phase in a partial share over the same time period as the moving average (1%, .67%, .33% below).
Here is our final forecast:
Tips and Tricks
Finding Data And Assumptions
Forecasts are only as good as the data and assumptions you put into them. So where can you find solid data? If you have an existing business, the first place to look is your financial system. Historical data is one of the best inputs to a forecast. You can also work with your operations teams to understand what it will take to deliver a certain level of performance.
For a new business or new product line with historical info, you will have to dig a bit deeper. Economic data and market research are your best bets. This can include digging into resources like the Consumer Product Index (CPI) for inflation or studying your competitors.
Step Back And Do A Gut Check
As you get into the weeds of your forecast, it is important to step back and ask yourself, “Does this make sense?” Think about how the forecast looks year-over-year and sequentially. Do you have the capacity and workforce to even deliver the forecast? Do the trends seem reasonable or are there unusual outliers in the forecast?
It is critical to sanity-check your work to ensure you put out a great product
Build For the Future
When working on a forecast, do yourself a huge favor and build it for the future. Well, obviously a forecast is for the future, but I mean the model itself. If you are running a forecast today, you are likely to run the forecast again. Make sure the model is dynamic enough to pull in new actuals and roll forward for future time periods. Avoid hardcoding, and try to link everything up to data tables. Make it clear which periods and cells are actuals and which are forecast.
This may take some extra time to set up, but it will really pay off down the road.
Let’s Recap
Forecasting COGS is a critical part of financial forecasting for any business. In this blog post, we have discussed the simple percentage of sales revenue method as well as some tips and tricks to help you collect accurate data and assumptions. We have also walked through an example Excel workbook. These skills can help businesses price their products correctly, budget for inventory, and make other strategic decisions.
Have any questions on how to forecast cost of goods sold? Are there other topics you would like us to cover? Leave a comment below and let us know! Make sure to subscribe to our Newsletter to receive exclusive financial news right to your inbox.
Thanks for your good information