The Easy Guide To The GoogleFinance Function
Remember the dark days of manually tracking stock prices in spreadsheets? You’d start with a well-meaning Google search, then copy and paste numbers into cells, only to realize five minutes later the market had already moved. By the time you double-checked the data, your carefully curated sheet looked like someone tossed a stock ticker salad.
Yeah, been there, done that—and I’m never going back. Enter GoogleFinance, the game-changing function in Google Sheets that turns those chaos-filled hours into seconds of pure organization. It’s like having a finance-savvy assistant who skips the coffee jitters and gets right to the data.
With GoogleFinance, you can pull financial data, historical stock data, and even currency exchange rates directly into your spreadsheet. Whether you’re dabbling in investments, managing a portfolio, or simply trying to budget for an overseas trip (hello, currency tracker!), this tool has your back. It’s user-friendly, incredibly powerful, and a lifesaver for math-weary brains.
This guide will take you through everything you need to know—starting with the basics and working up to advanced techniques that’ll impress your boss, your clients, or even yourself. Along the way, I’ll toss in some real-life applications so you can see how this function works its magic beyond the formulas. Whether you’re a student wanting to track your first mock portfolio, a budget-conscious investor analyzing trends, or a pro spreadsheet nerd building dashboards for your team, you’re in the right place.
What Is the GoogleFinance Function?
If Google Sheets had a superpower, it’d be the GoogleFinance function. Imagine having a live stock ticker right inside your spreadsheet—one that doesn’t need constant refreshing or your undivided attention. That’s what this little gem does. It’s like giving your spreadsheet a direct hotline to the stock market, so you can pull in real-time or historical financial data without lifting more than a finger (well, maybe two—because typing still exists).
The GOOGLEFINANCE Function In Google Sheets that fetches data on stock prices, currency exchange rates, mutual fund data, daily highs and lows, and even trading volume. Whether you’re keeping tabs on your favorite stocks, planning your next budget-friendly Eurotrip with currency rates, or just nerding out with some historical trends, this function’s got you covered.
Here’s a quick example to show you how simple it is:
=GoogleFinance("GOOG")
That’s it. Just type that formula into any cell, and voila—live stock price data for Alphabet Inc. (aka Google) pops right in. By default, it gives you the real-time price (within a ~20-minute lag, but no big deal for most of us). Now imagine scaling that up to track multiple stocks, currencies, or even creating your own personal market dashboard.
Setting Up for Success
Before we start pulling numbers and flexing GoogleFinance’s data magic, you gotta set the stage. Think of this as prepping your workbench before you start building—because a well-organized spreadsheet makes all the difference.
Preparing Your Workspace
Step 1: Open Google Sheets
This might seem obvious, but hey, every masterpiece starts with a blank canvas. If you haven’t already, fire up Google Sheets. You can do this through Google Drive (click the big, shiny “+ New” button and choose “Google Sheets”) or just head to sheets.google.com.
Step 2: Name Your Spreadsheet
Start by giving your spreadsheet a name—something you won’t forget in five minutes like “My Awesome Stock Tracker” or “Currency Kings.” Trust me, future you will appreciate this when trying to dig it up later.
Step 3: Create Clear Headers and Layouts
Think of headers as the backbone of your spreadsheet. Add column headers like “Ticker,” “Price,” “High,” “Low,” “Volume,” or any other data you’ll be pulling. A clean setup will keep your data organized and easier to read.
Step 4: Color-Code Columns (Optional, But Awesome)
If you’re planning to track a ton of data, color-coding columns can save your sanity. For example:
- Use green for pricing info.
- Highlight historical data in yellow.
It’s not just pretty—it makes skimming easier when you’re presenting or analyzing data.
Step 5: Lock Headers for Easy Scrolling
Click View > Freeze > 1 Row to lock your headers in place. This way, when you scroll endlessly down, you won’t lose track of what the columns mean. Small trick, huge lifesaver.
Once your workspace is set and looks less like chaos and more like a pro dashboard in the making, it’s time to bring in the star of the show—the GoogleFinance syntax.
Syntax Breakdown
Using GoogleFinance might seem intimidating at first glance, but trust me, once you crack the formula, you’ll wonder how you managed without it. Here’s the syntax:
=GoogleFinance("ticker", [attribute], [start_date], [end_date|num_days], [interval])
If this looks like a foreign language, don’t worry—we’re breaking it down piece by piece right now.
1. Ticker
This is your stock’s symbol. For instance, if you want data for Apple, use “AAPL.” Need info on Tesla? Enter “TSLA.” Simple, right? Just remember, ticker symbols are case-sensitive—caps lock ON.
2. Attribute (Optional)
This tells GoogleFinance what specific data you want. Here are some popular choices:
- `”price”` for the current stock price.
- `”high”` for the daily high.
- `”low”` for the daily low.
- `”volume”` for the trading volume.
If you skip this part, GoogleFinance defaults to price. Good for a quick look, but if you’re after detailed insights, specifying the attribute is the way to go.
3. Start Date & End Date (Optional)
Want historical data? These fields are your time machine. Use the `DATE(year, month, day)` format like this:
=GoogleFinance("AAPL", "close", DATE(2023,1,1), DATE(2023,10,1))
This will give you Apple’s closing prices from January 1, 2023, to October 1, 2023.
If you’re only interested in trends over a specific number of days, you can swap the end date for `num_days`. For example:
=GoogleFinance("AAPL", "close", DATE(2023, 1, 1), 30)
4. Interval (Optional)
Use this to define how often you want data points when dealing with historical data:
- `”DAILY”` is the default and gives a snapshot for each trading day.
- `”WEEKLY”` (not officially in the syntax) is available when you group data visually with charts, but for raw data, stick with daily for now.
Here’s a quick example to tie it all together:
=GoogleFinance("MSFT", "price")
This fetches Microsoft’s current stock price. Easy-peasy.
Using GoogleFinance for Real-Time Data
One of the coolest tricks up GoogleFinance’s sleeve is its ability to pull real-time data directly into your spreadsheet—no frantic tab-switching or manual updates needed. Whether you’re tracking stock prices or monitoring currency exchange rates, this function keeps you ahead of the game.
Current Stock Prices
Tracking live stock prices is as simple as typing a formula. For example, to keep an eye on Microsoft’s stock, all you need to do is this:
=GoogleFinance("MSFT", "price")
And boom—Microsoft’s latest stock price appears in your cell, refreshed automatically. By default, the data updates roughly every 20 minutes, which is plenty for most use cases (unless you’re day trading, in which case, good luck, my friend).
Pro Tip—What if something goes wrong?
If you see an error like `#N/A` or `#VALUE!`, don’t panic—it’s not you; it’s one of two things:
- Incorrect ticker symbol—Double-check that you’ve entered the correct ticker. Stock symbols are case-sensitive, so “msft” won’t work, but “MSFT” will.
- Unavailable data—Sometimes, especially for newer or less common stocks, the data might not be available through GoogleFinance. If this happens, consider cross-referencing with another source.
Case Study Example #1
During Tesla’s (TSLA) latest earnings season, my productivity was in danger of nosediving. I wanted to track TSLA’s stock price in real-time without refreshing financial websites every 10 minutes. My solution? A simple formula:
=GoogleFinance("TSLA", "price")
This brought Tesla’s live stock price straight into my spreadsheet, keeping me on top of market movements without turning into a basket case. Bonus? I could easily chart the price changes for some quick trend analysis. Crisis avoided.
Monitoring Currency Exchange Rates
Ever tried mentally converting USD to Euros while calculating travel expenses? Yeah, it’s not fun. Luckily, GoogleFinance can track real-time currency exchange rates with barely any effort. Here’s how to do it:
=GoogleFinance("CURRENCY:USDEUR")
This pulls in the current exchange rate between the US Dollar (USD) and the Euro (EUR). All you need is to swap out the currency codes for the ones you need—whether it’s USD to JPY (Japanese Yen) or GBP to INR (Indian Rupee).
Real-World Applications
- Travel Budget Planning—Create a dynamic travel budget that updates with the latest conversion rates. Perfect for locking in costs when the exchange rate is in your favor.
- International Investments—Monitoring forex trends is crucial when investing in foreign markets. This function keeps your data fresh 24/7.
Case Study Example #2
A few years ago, I was planning a dream trip to Europe. Flights, hotels, daily expenses—everything depended on a fluctuating exchange rate. To avoid blowing up my budget, I used GoogleFinance to create a real-time currency tracker:
=GoogleFinance("CURRENCY:USDGBP")
With each refresh, my spreadsheet showed the exact rate to convert US Dollars to British Pounds. This helped me lock in a budget-friendly rate when booking big expenses. No messy calculations, no surprises. Honestly? Best decision I made on that trip.
Harnessing Historical Data Like a Pro
Real-time data is great, but sometimes the real treasure lies in the past. Whether you’re devising an investment strategy, crafting a business report, or just satisfying your inner data nerd, GoogleFinance can help you fetch and analyze historical data like a seasoned pro.
Fetching Historical Price Data
One of GoogleFinance’s most powerful features is its ability to pull historical price data for any stock. Need to study trends or compare performance between two time periods? The function lets you specify dates and retrieves all the data for you—quick and painless.
Here’s the syntax for fetching historical data for Apple’s closing prices between January 1, 2023, and October 1, 2023:
=GoogleFinance("AAPL", "close", DATE(2023,1,1), DATE(2023,10,1))
When you plug this into Google Sheets, you’ll see a neat table showing the historical closing prices for Apple during that date range. This isn’t just convenient—it’s game-changing. Imagine the hours saved compared to manually copying and pasting this from a financial website.
Why Historical Data Rocks:
Analyzing historical data is like stepping into a time machine for insights. It helps you:
- Spot trends: Are certain stocks cyclical? Do they surge during specific quarters?
- Build strategies: Use patterns to inform investment decisions.
- Back up reports: Historical context delivers credibility in business presentations or case studies.
Case Study Example #3
A while back, I had to generate a report analyzing Amazon’s (AMZN) stock movements over the past year. Instead of tediously pulling numbers from different sources, I dropped this formula into my sheet:
=GoogleFinance("AMZN", "close", DATE(2022,1,1), DATE(2022,12,31))
Within seconds, I had every closing price from that year at my fingertips. From there, it was easy to create charts and spot trends—all without breaking a sweat.
Using Different Attributes
Now, what if you need historical data beyond closing prices? Thankfully, GoogleFinance can retrieve multiple attributes to fit your specific needs.
Some key attributes include:
- `”high”` – Daily high price, useful for tracking peaks.
- `”low”` – Daily low price, ideal for assessing bottoms.
- `”volume”` – Trading volume, crucial for gauging market interest and activity.
Here’s an example of fetching a different attribute—say, the daily high prices for Tesla (TSLA) in September 2023:
=GoogleFinance("TSLA", "high", DATE(2023,9,1), DATE(2023,9,30))
Example Use Cases:
- Stock Analysts: Trading volume helps analysts evaluate liquidity and market sentiment.
- Long-term Investors: High/low prices reveal a stock’s volatility and support decision-making.
- Business Forecasters: Historical highs/lows provide context for predicting future price ranges.
Stock Details (Attributes) Available
real-time data:
"price"– Real-time price quote, delayed by up to 20 minutes."priceopen"– The price as of market open."high"– The current day’s high price."low"– The current day’s low price."volume"– The current day’s trading volume."marketcap"– The market capitalization of the stock."tradetime"– The time of the last trade."datadelay"– How far delayed the real-time data is."volumeavg"– The average daily trading volume."pe"– The price/earnings ratio."eps"– The earnings per share."high52"– The 52-week high price."low52"– The 52-week low price."change"– The price change since the previous trading day’s close."beta"– The beta value."changepct"– The percentage change in price since the previous trading day’s close."closeyest"– The previous day’s closing price."shares"– The number of outstanding shares."currency"– The currency in which the security is priced. Currencies don’t have trading windows, soopen,low,high, andvolumewon’t return for this argument.
historical data:
"open"– The opening price for the specified date(s)."close"– The closing price for the specified date(s)."high"– The high price for the specified date(s)."low"– The low price for the specified date(s)."volume"– The volume for the specified date(s)."all"– All of the above.
mutual fund data:
"closeyest"– The previous day’s closing price."date"– The date at which the net asset value was reported."returnytd"– The year-to-date return."netassets"– The net assets."change"– The change in the most recently reported net asset value and the one immediately prior."changepct"– The percentage change in the net asset value."yieldpct"– The distribution yield, the sum of the prior 12 months’ income distributions (stock dividends and fixed income interest payments), and net asset value gains divided by the previous month’s net asset value number."returnday"– One-day total return."return1"– One-week total return."return4"– Four-week total return."return13"– Thirteen-week total return."return52"– Fifty-two-week (annual) total return."return156"– 156-week (3-year) total return."return260"– 260-week (5-year) total return."incomedividend"– The amount of the most recent cash distribution."incomedividenddate"– The date of the most recent cash distribution."capitalgain"– The amount of the most recent capital gain distribution."morningstarrating"– The Morningstar “star” rating."expenseratio"– The fund’s expense ratio.
Example – Using Googlefinance Function To Track Stocks
Google Sheets Workbook
Example
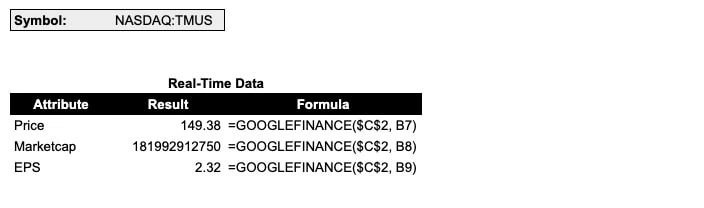
First, let’s use the Googlefinance function to work with real-time data. We will look up TMUS which is the ticker for T-Mobile and listed on the NASDAQ.


Common Errors and How to Fix Them
Even the best tools can throw you for a loop sometimes, and GoogleFinance is no exception. Errors happen, but they’re rarely as scary as they look. Here’s how to identify and fix the most common hiccups you might encounter while working with this function.
Error Types
When GoogleFinance stumbles, it usually tells you why—though admittedly, the messages could be clearer. Here are the usual suspects:
`#N/A` — Data Not Available
This one means GoogleFinance can’t find the data you’re asking for. It’s usually caused by an issue with the ticker symbol. Think of it like typing “Missippi” into Google Maps—you’re not going to find what you’re looking for.
`#VALUE!` — Invalid Function Setup
This pops up if the function isn’t configured correctly. Maybe you’ve left out a required input, misplaced a quotation mark, or typed a formula that Google Sheets doesn’t recognize. It’s basically the spreadsheet equivalent of waving a big red flag and saying, “Help!”
Troubleshooting Guide
Okay, so you’ve got an error. Now what? Follow these steps to troubleshoot and resolve the issue like a pro.
Step 1: Double-Check the Ticker Symbol
If you’re seeing `#N/A`, the first thing to do is verify your ticker. Remember:
- Use the stock’s exact symbol (like “AAPL” for Apple).
- Symbols are case-sensitive—so “TSLA,” not “tsla.”
If you’re unsure, look up the ticker on Google or your favorite finance site like Yahoo Finance.
Example: You try this formula and get an error:
=GoogleFinance("appl", "price")
Oops! The ticker is wrong (it’s “AAPL,” not “appl”). Fix the syntax, and your data will load.
Step 2: Verify Function Syntax
The `#VALUE!` error often means something is off in the formula. Here are common mistakes:
- Missing quotes around text inputs (like ticker symbols or attributes).
- Forgetting to add required arguments, like `”price”` or a valid date format.
- Extra spaces sneaking into your formula—these can confuse Google Sheets.
Example: Imagine you try this:
=GoogleFinance(AAPL, price)
Do you see the problem? Without quotes around `AAPL` and `price`, Google Sheets doesn’t know they’re text. Fix it like this:
=GoogleFinance("AAPL", "price")
And voilà! The data appears.
Step 3: Check Internet Connectivity
Because GoogleFinance pulls live data, it needs a stable internet connection. If your Wi-Fi is spotty, the function might return errors. A quick refresh or reconnection solves this in most cases.
Step 4: Look Up Supported Stocks/Currencies
Some lesser-known stocks or exotic currency pairs aren’t supported by GoogleFinance. If you’re getting `#N/A` for a valid ticker, this might be the issue. Unfortunately, not every data point is accessible via GoogleFinance—but hey, you can still try looking it up manually.
Advanced Techniques to Up Your Game
By now, you’re probably feeling like a GoogleFinance rockstar. But why stop at the basics when you can take your spreadsheet game to the next level? Here’s how to harness advanced techniques like linking data across sheets and creating dashboards that’ll make your boss (or clients) think you’ve practically got a crystal ball.
Linking Data Across Sheets
Ever dreamt of consolidating data across multiple tabs or even sheets? GoogleFinance plays well with others, allowing you to link data wherever you need it. Whether you’re managing a diverse investment portfolio or tracking stock performance by industry, linking data ensures everything stays connected and consistent.
Here’s a simple example of how to pull stock data into a separate sheet:
- On Sheet1, use a standard GoogleFinance formula to grab data—say, Apple’s current stock price:
=GoogleFinance("AAPL", "price")
- Switch to Sheet2 and reference the data like this:
=Sheet1!A1
Replace `A1` with the actual cell containing the data you want to link.
Now your data stays synced, no matter where you view it. You can use this same technique to connect multiple sheets—great for tracking different industries, time zones, or specific investment goals.
Practical Application Example:
Last month, I built a comprehensive portfolio tracker for a friend dabbling in tech, healthcare, and consumer goods. Each sheet was dedicated to a sector, pulling GoogleFinance data for relevant companies. On the main dashboard tab, I linked all the sheets together. The result? A centralized view of portfolio performance, all updated in real time. My friend? Blown away. Spreadsheet legend status achieved.
Building Dashboards with GoogleFinance
Dashboards aren’t just pretty—they’re powerful. With the GoogleFinance function in google sheets, you can build one that consolidates stock performance, charts data trends, and presents it all in a way that even “Excel-averse” team members can understand.
Step 1: Pull in Your GoogleFinance Data
Start by listing the stocks or assets you want to track in Column A—for example:
“`
A1: Ticker
A2: MSFT
A3: TSLA
A4: AAPL
“`
Then, in Column B, fetch the latest prices:
=GoogleFinance(A2, "price")
Drag the formula down for the rest of the tickers in the list.
Step 2: Create Charts for Easy Visualization
Once your data is flowing, it’s time to make it pop:
- Highlight the data range you want to chart (e.g., Stock Symbols and Prices).
- Go to Insert > Chart, and select a format like a bar chart, line graph, or pie chart depending on the story you’re telling.
- Customize the titles, labels, and colors to make it both visually compelling and informative.
Step 3: Add Automation for Trend Analysis
GoogleFinance doesn’t just do current data—it handles historical data, too. Layer in a formula like this to chart closing prices over time:
=GoogleFinance("GOOG", "close", DATE(2023,1,1), TODAY())
Visualize this data alongside current prices for a dashboard that screams “market genius.”
