How to Build a Power BI Report With AI Using The Power BI MCP

I handed Claude a raw file and Microsoft’s new Power BI MCP and asked it to build a full report. Here’s exactly how it works, where it shines, and where it still trips.

Power BI plus AI, from someone who builds the reports and then has to explain them in the meeting. DAX written with Claude, AI-generated commentary, custom visuals, the Power BI MCP, and dashboards that answer the question before anyone asks it. Self-service analytics too, since that is usually the promise nobody delivered.
I handed Claude a raw file and Microsoft’s new Power BI MCP and asked it to build a full report. Here’s exactly how it works, where it shines, and where it still trips.

Five Power BI tasks Claude handled on a real board dashboard: custom variance cards, a broken DAX fix, row-level security, live commentary, and the board summary.
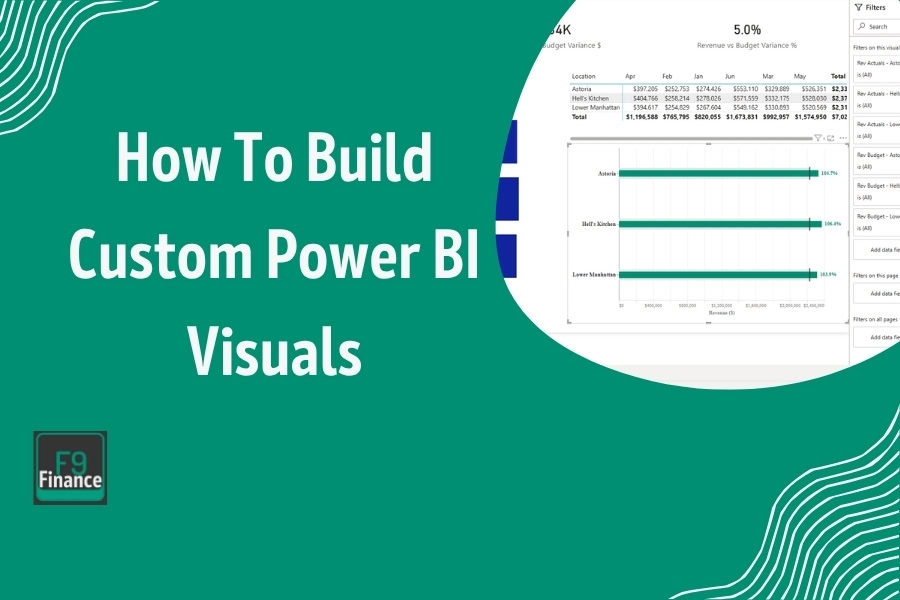
Learn how to build custom Power BI visuals using Claude and the free HTML Viewer, no coding or developer needed. Includes exact prompts for finance variance reporting.
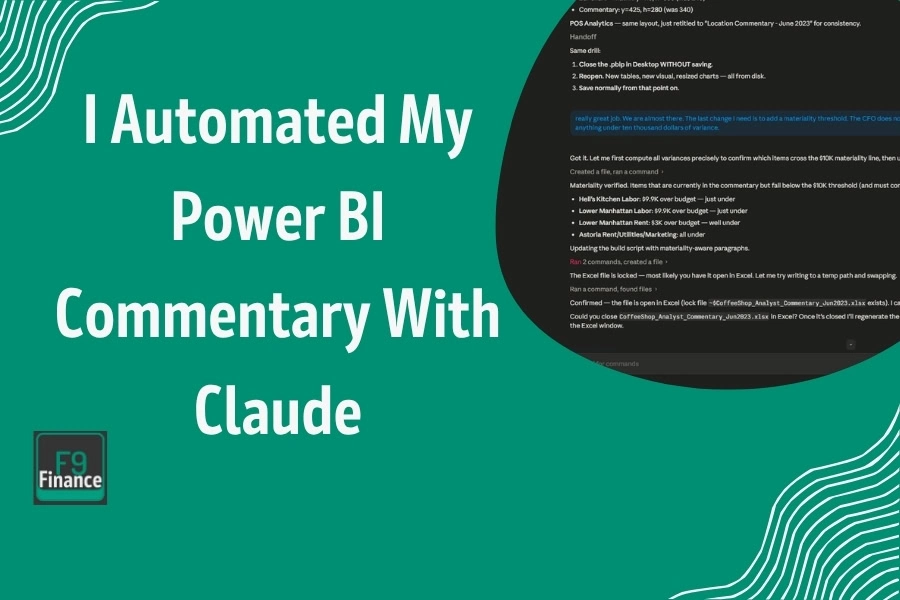
I use a Claude Code script to pull data from Power BI, generate variance commentary, and write it back to my dashboard every month. Here’s the full setup.
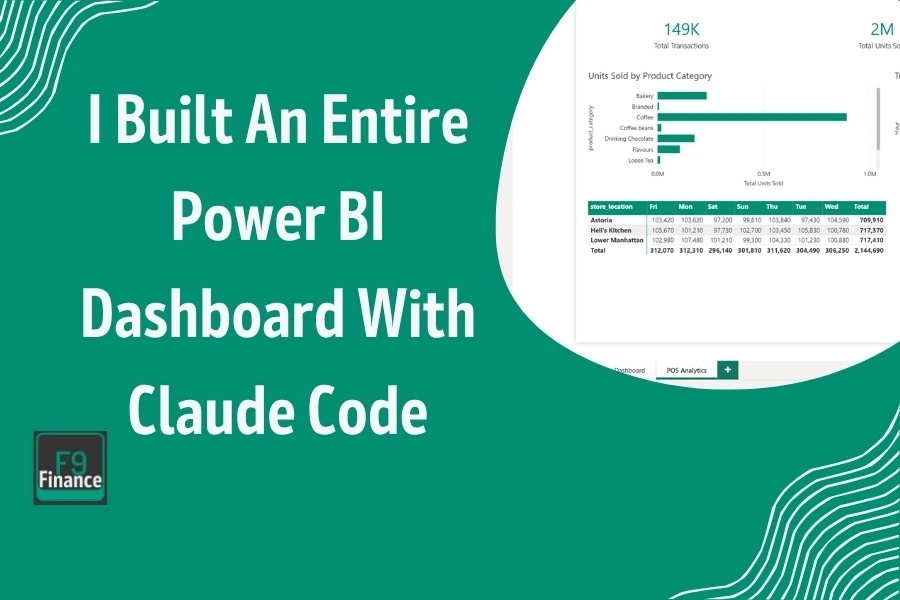
Step-by-step walkthrough of using Claude Code to build a fully formatted Power BI dashboard.

I’ll walk you step-by-step through building AI dashboards including the best tools, prompting, design, refining, and guardrails.

You do not need to know everything about Tableau For Finance to use it well. This guide will get you up to speed fast with the essentials!
Over the last year, I’ve been using AI in Power Pivot to build, clean, debug, and document models, and it’s completely changed how I work.

This guide is my step-by-step walkthrough of everything I wish I had access to when I first started mixing Python in Power BI.
By the time you finish this guide, you’ll know how to design Power BI Models that are fast, clean, and reusable.
End of content
End of content